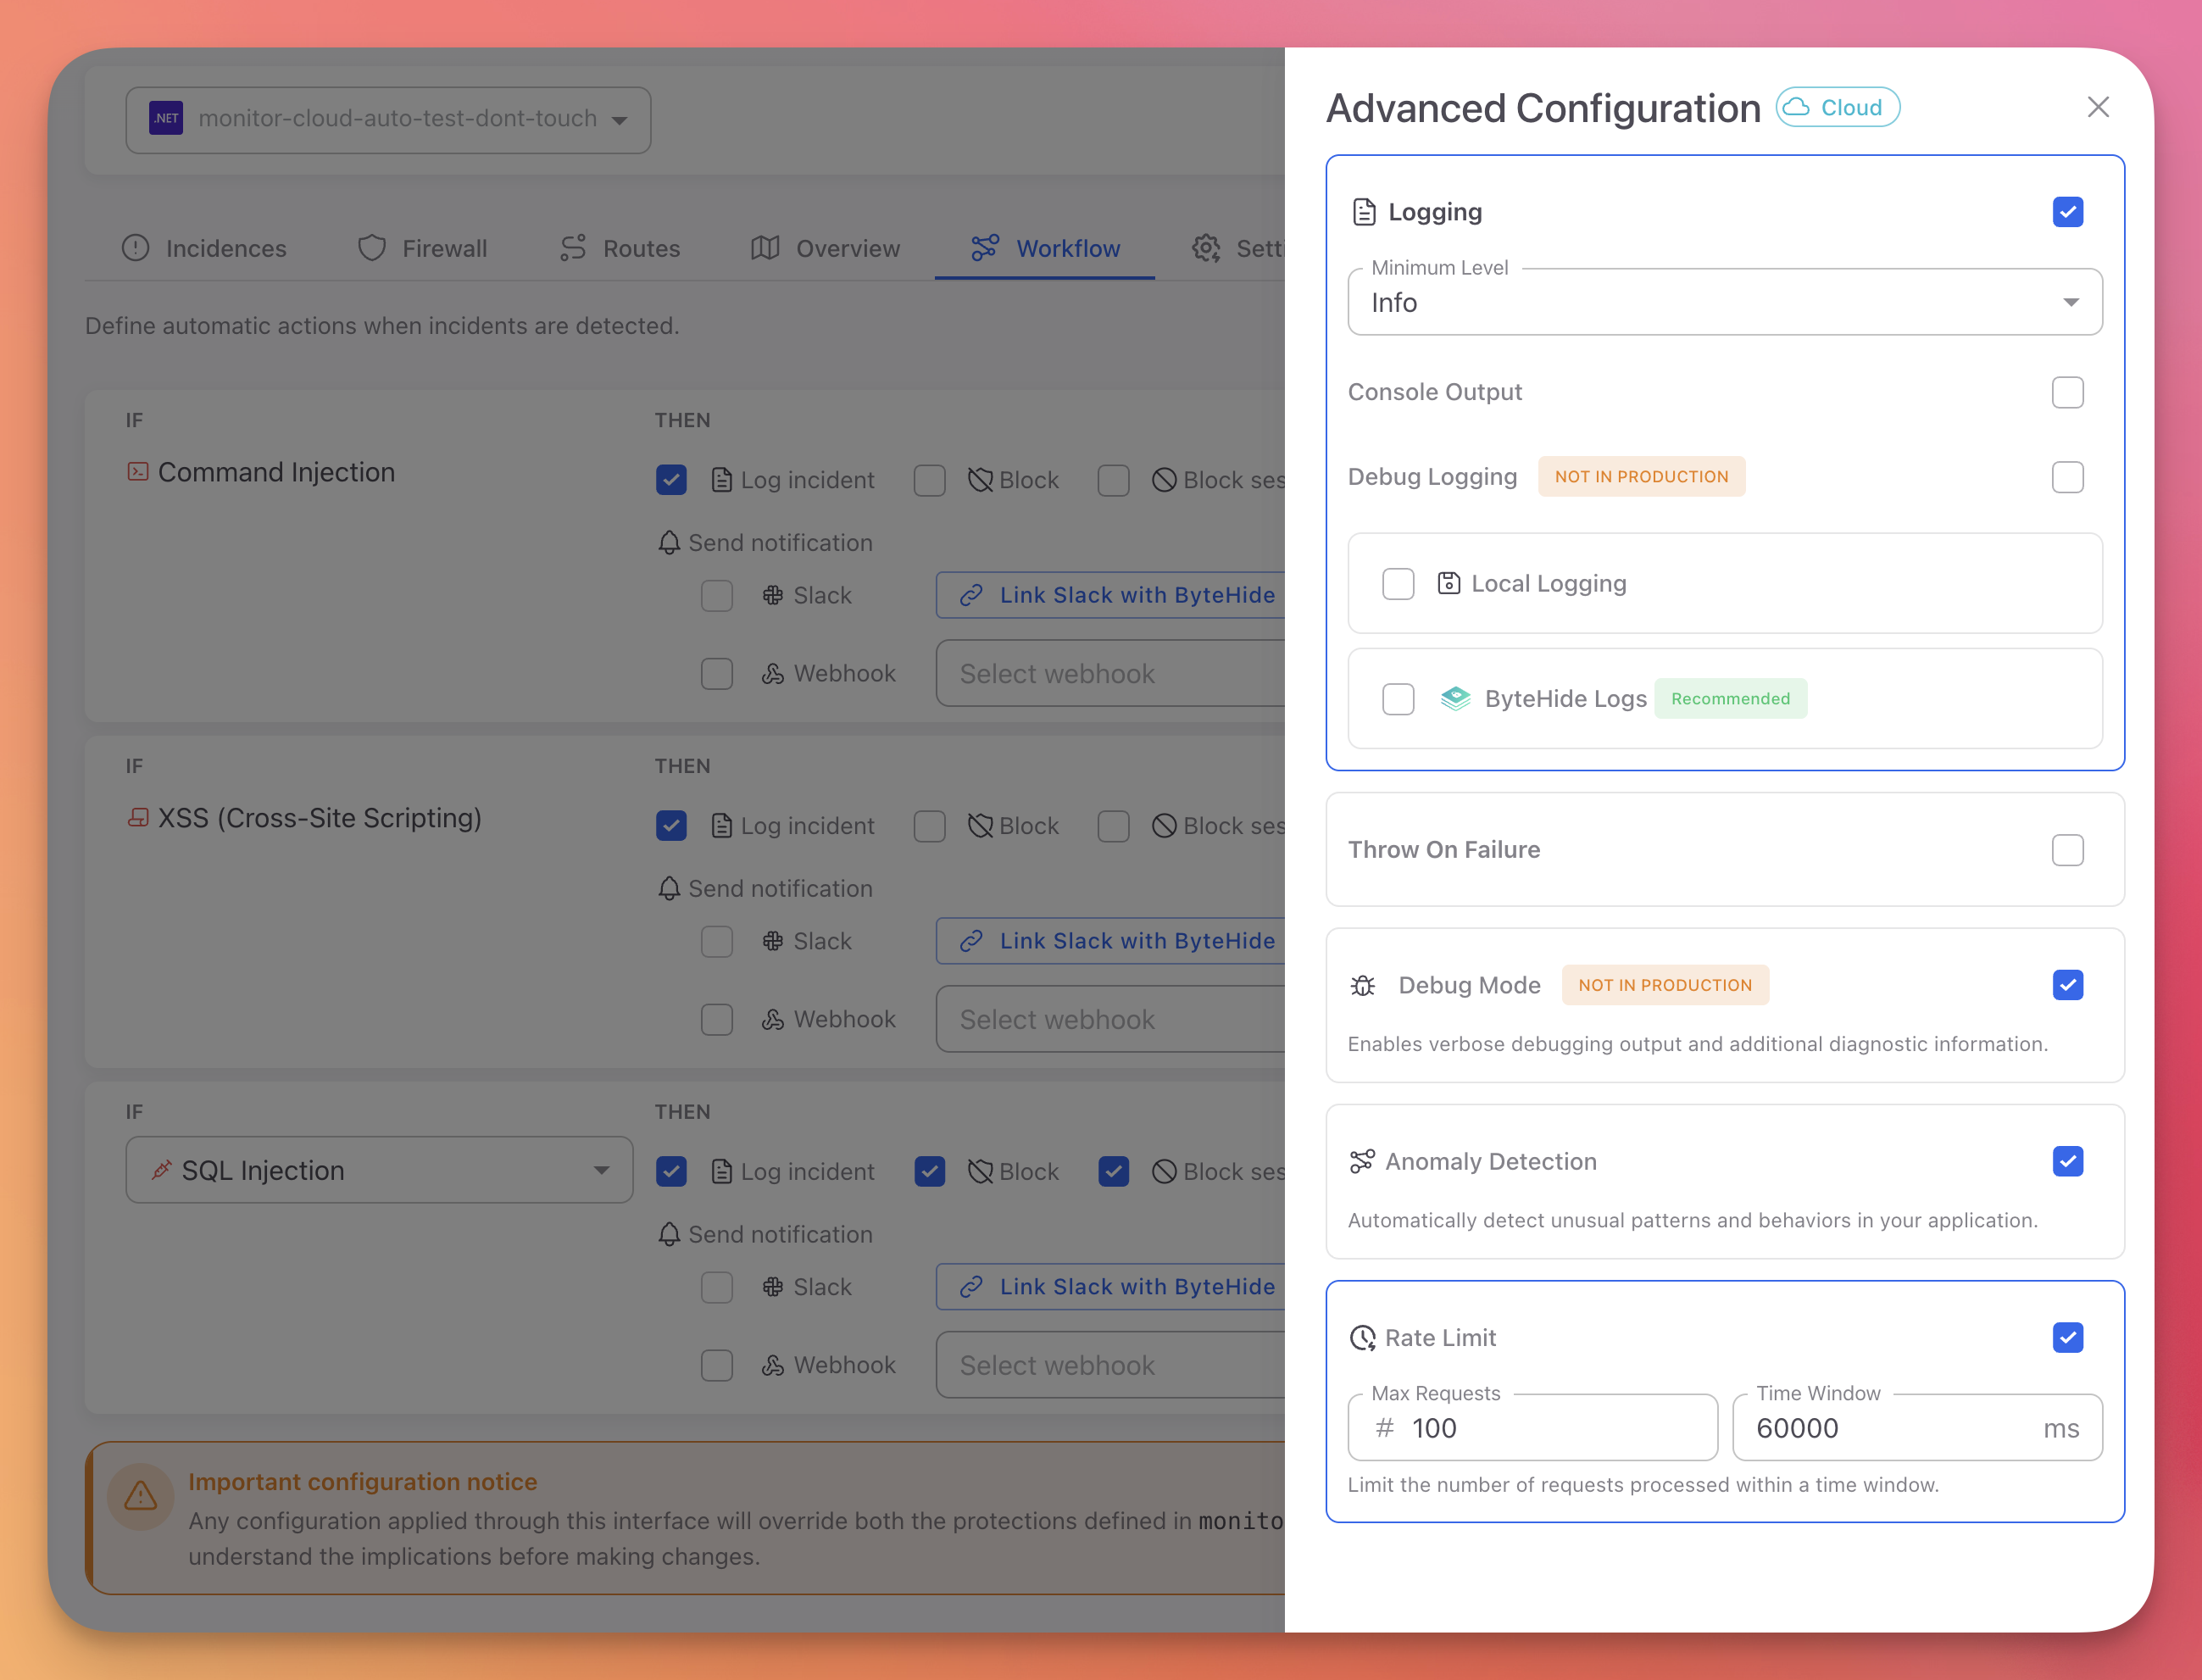
Advanced Configuration
Configure Monitor's operational behavior from the Cloud Panel. These settings control logging, error handling, anomaly detection, and rate limiting. Changes apply in real-time without restarting your application.
Access
Open the Workflow tab and click the Advanced Config button in the top right corner.
 Click to expand
Configuration Priority
Advanced Configuration settings in the Cloud Panel override JSON and code-based configuration. See Configuration Priority for details.
Logging Configuration
Minimum Level
Select the minimum severity level for log output. Events below this level are discarded.
| Level | Use case |
|---|---|
| Trace | Maximum detail, framework internals |
| Debug | Development troubleshooting |
| Info | General operational events |
| Warning | Potential issues that need attention |
| Error | Failures that need investigation |
Recommended: info or warning for production. debug for development only.
Console Output
Toggle console logging to stdout/stderr. Enable this when running in containers (Docker, Kubernetes) or cloud environments where logs are collected from stdout (CloudWatch, Azure Monitor, Google Cloud Logging).
Local Logging (File)
Toggle file-based logging with automatic rotation.
- File Path:
logs/bytehide-monitor.log - Max Size: 10 MB per file before rotation
ByteHide Logs Integration
Send Monitor logs to ByteHide Logs for encrypted cloud storage with AI-powered analysis and data masking.
- Toggle ByteHide Logs on
- Select your Logs project from the dropdown (or create one)
For the full logging reference including log levels, output destinations, and sensitive data masking, see Logging.
Throw On Failure
Use with caution
When enabled, any Monitor service error (network timeout, API failure, configuration error) will crash the application instead of logging the error and continuing. Only enable this in development to catch integration issues early.
Default: Disabled. Monitor logs errors internally and continues normal execution.
Debug Mode
Never enable in production
Debug mode includes detailed threat information in HTTP responses, which exposes your security configuration to attackers. See Debug Logging for what gets exposed and why it matters.
Toggle verbose request/response logging for development troubleshooting. When enabled, blocked responses include the full threatInfo object with protection module, confidence score, and matched patterns.
Anomaly Detection
AI-powered detection of unusual patterns that don't match a specific attack signature but indicate suspicious behavior.
Detects:
- IP address changes mid-session - Same session ID used from different IPs
- Geographic impossibilities - Requests from locations that are physically impossible given the time between them
- Request pattern anomalies - Unusual request frequency, timing, or sequencing
When anomalies are detected, they appear as incidents in the Incidences tab and can trigger Workflow Rules.
Rate Limiting
Limit the number of requests per IP address within a time window. Requests that exceed the limit receive HTTP 429 Too Many Requests.
| Setting | Description | Default |
|---|---|---|
| Max Requests | Maximum requests allowed per IP | 100 |
| Time Window | Time period in milliseconds | 60000 (1 minute) |
Example: With the defaults, each IP can make up to 100 requests per minute. The 101st request within the same minute window returns 429.
Next Steps
Logging
Full logging reference with log levels, output destinations, and debug mode details
Workflow Rules
Create IF/THEN automation rules for threat response
Cloud Configuration
How cloud configuration syncs and overrides other sources