Devices & Sessions
Monitor every device and server running your application. View geographic distribution, inspect device security status, drill into individual sessions, and take action on compromised devices.
Overview Dashboard
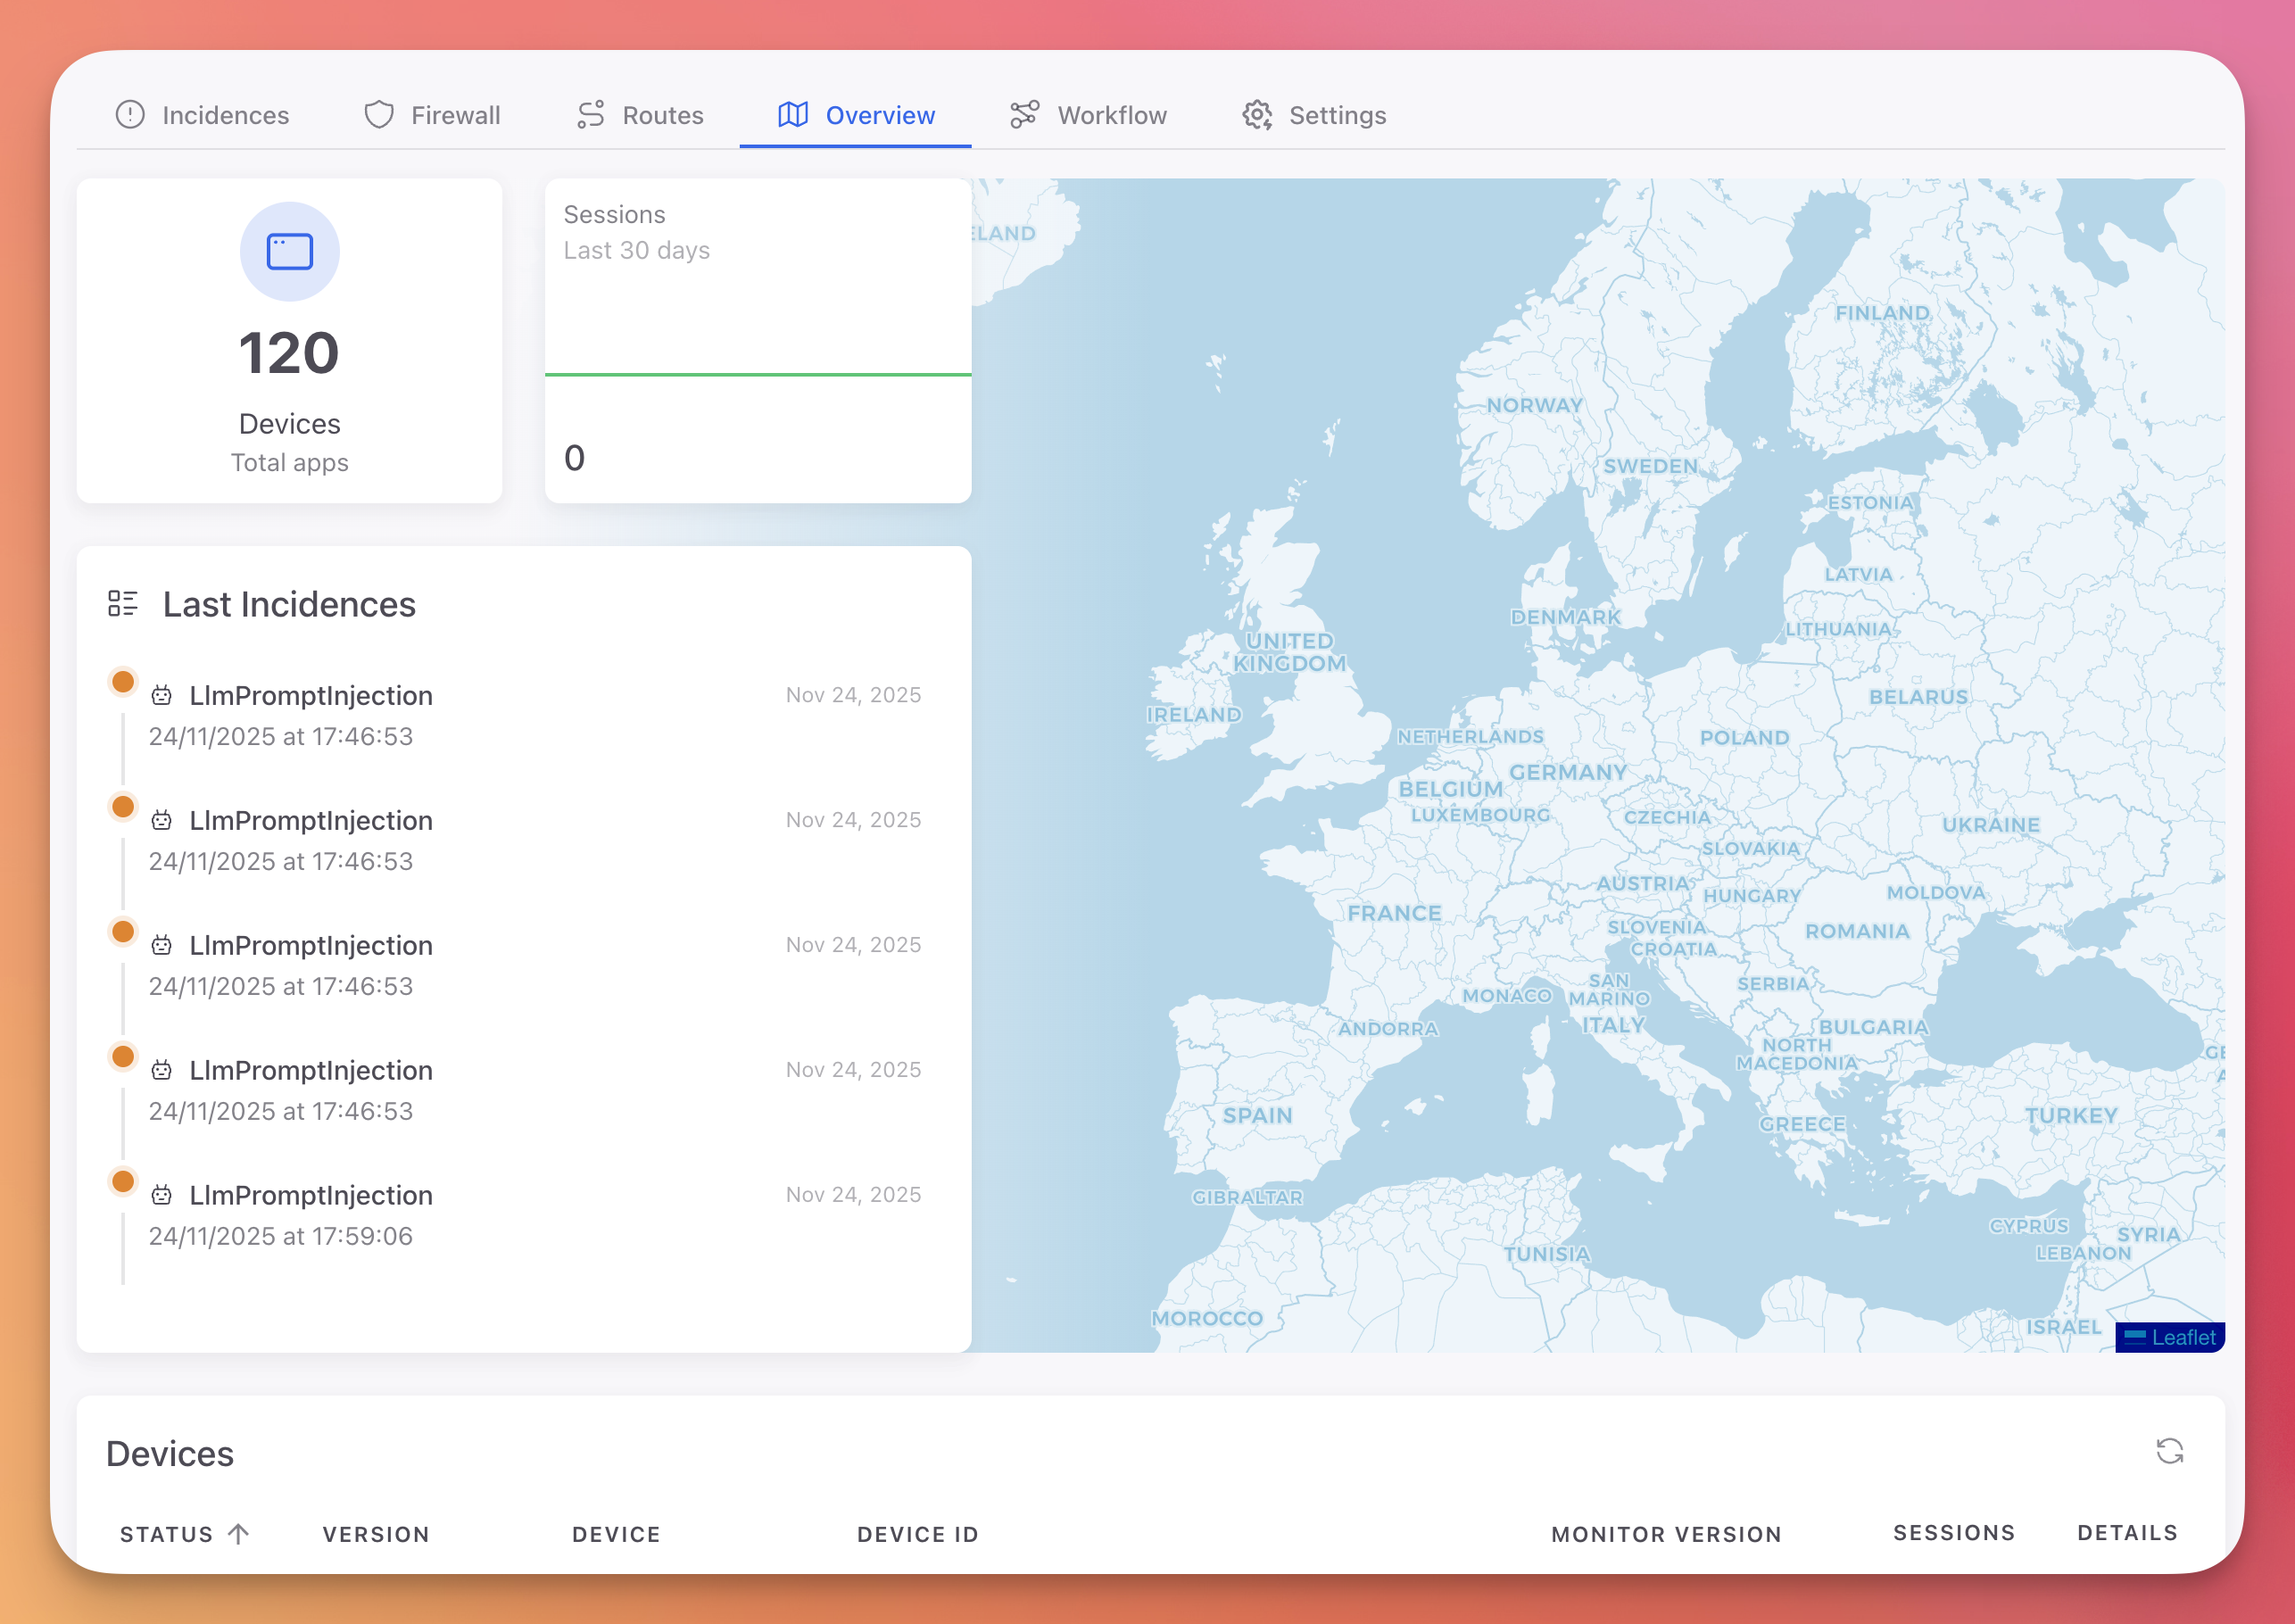
The Overview tab provides a high-level view of all application instances and their activity.
 Click to expand
 Click to expand
Statistics
| Card | Description |
|---|---|
| Devices | Total number of devices and servers running your application |
| Sessions | Session activity graph over the last 30 days |
Geographic Map
An interactive world map showing the geographic location of all devices running your application. Each marker represents a device or server, positioned based on IP geolocation.
Last Incidences
A summary of the 5 most recent security incidents detected across all devices, with the protection module name and timestamp.
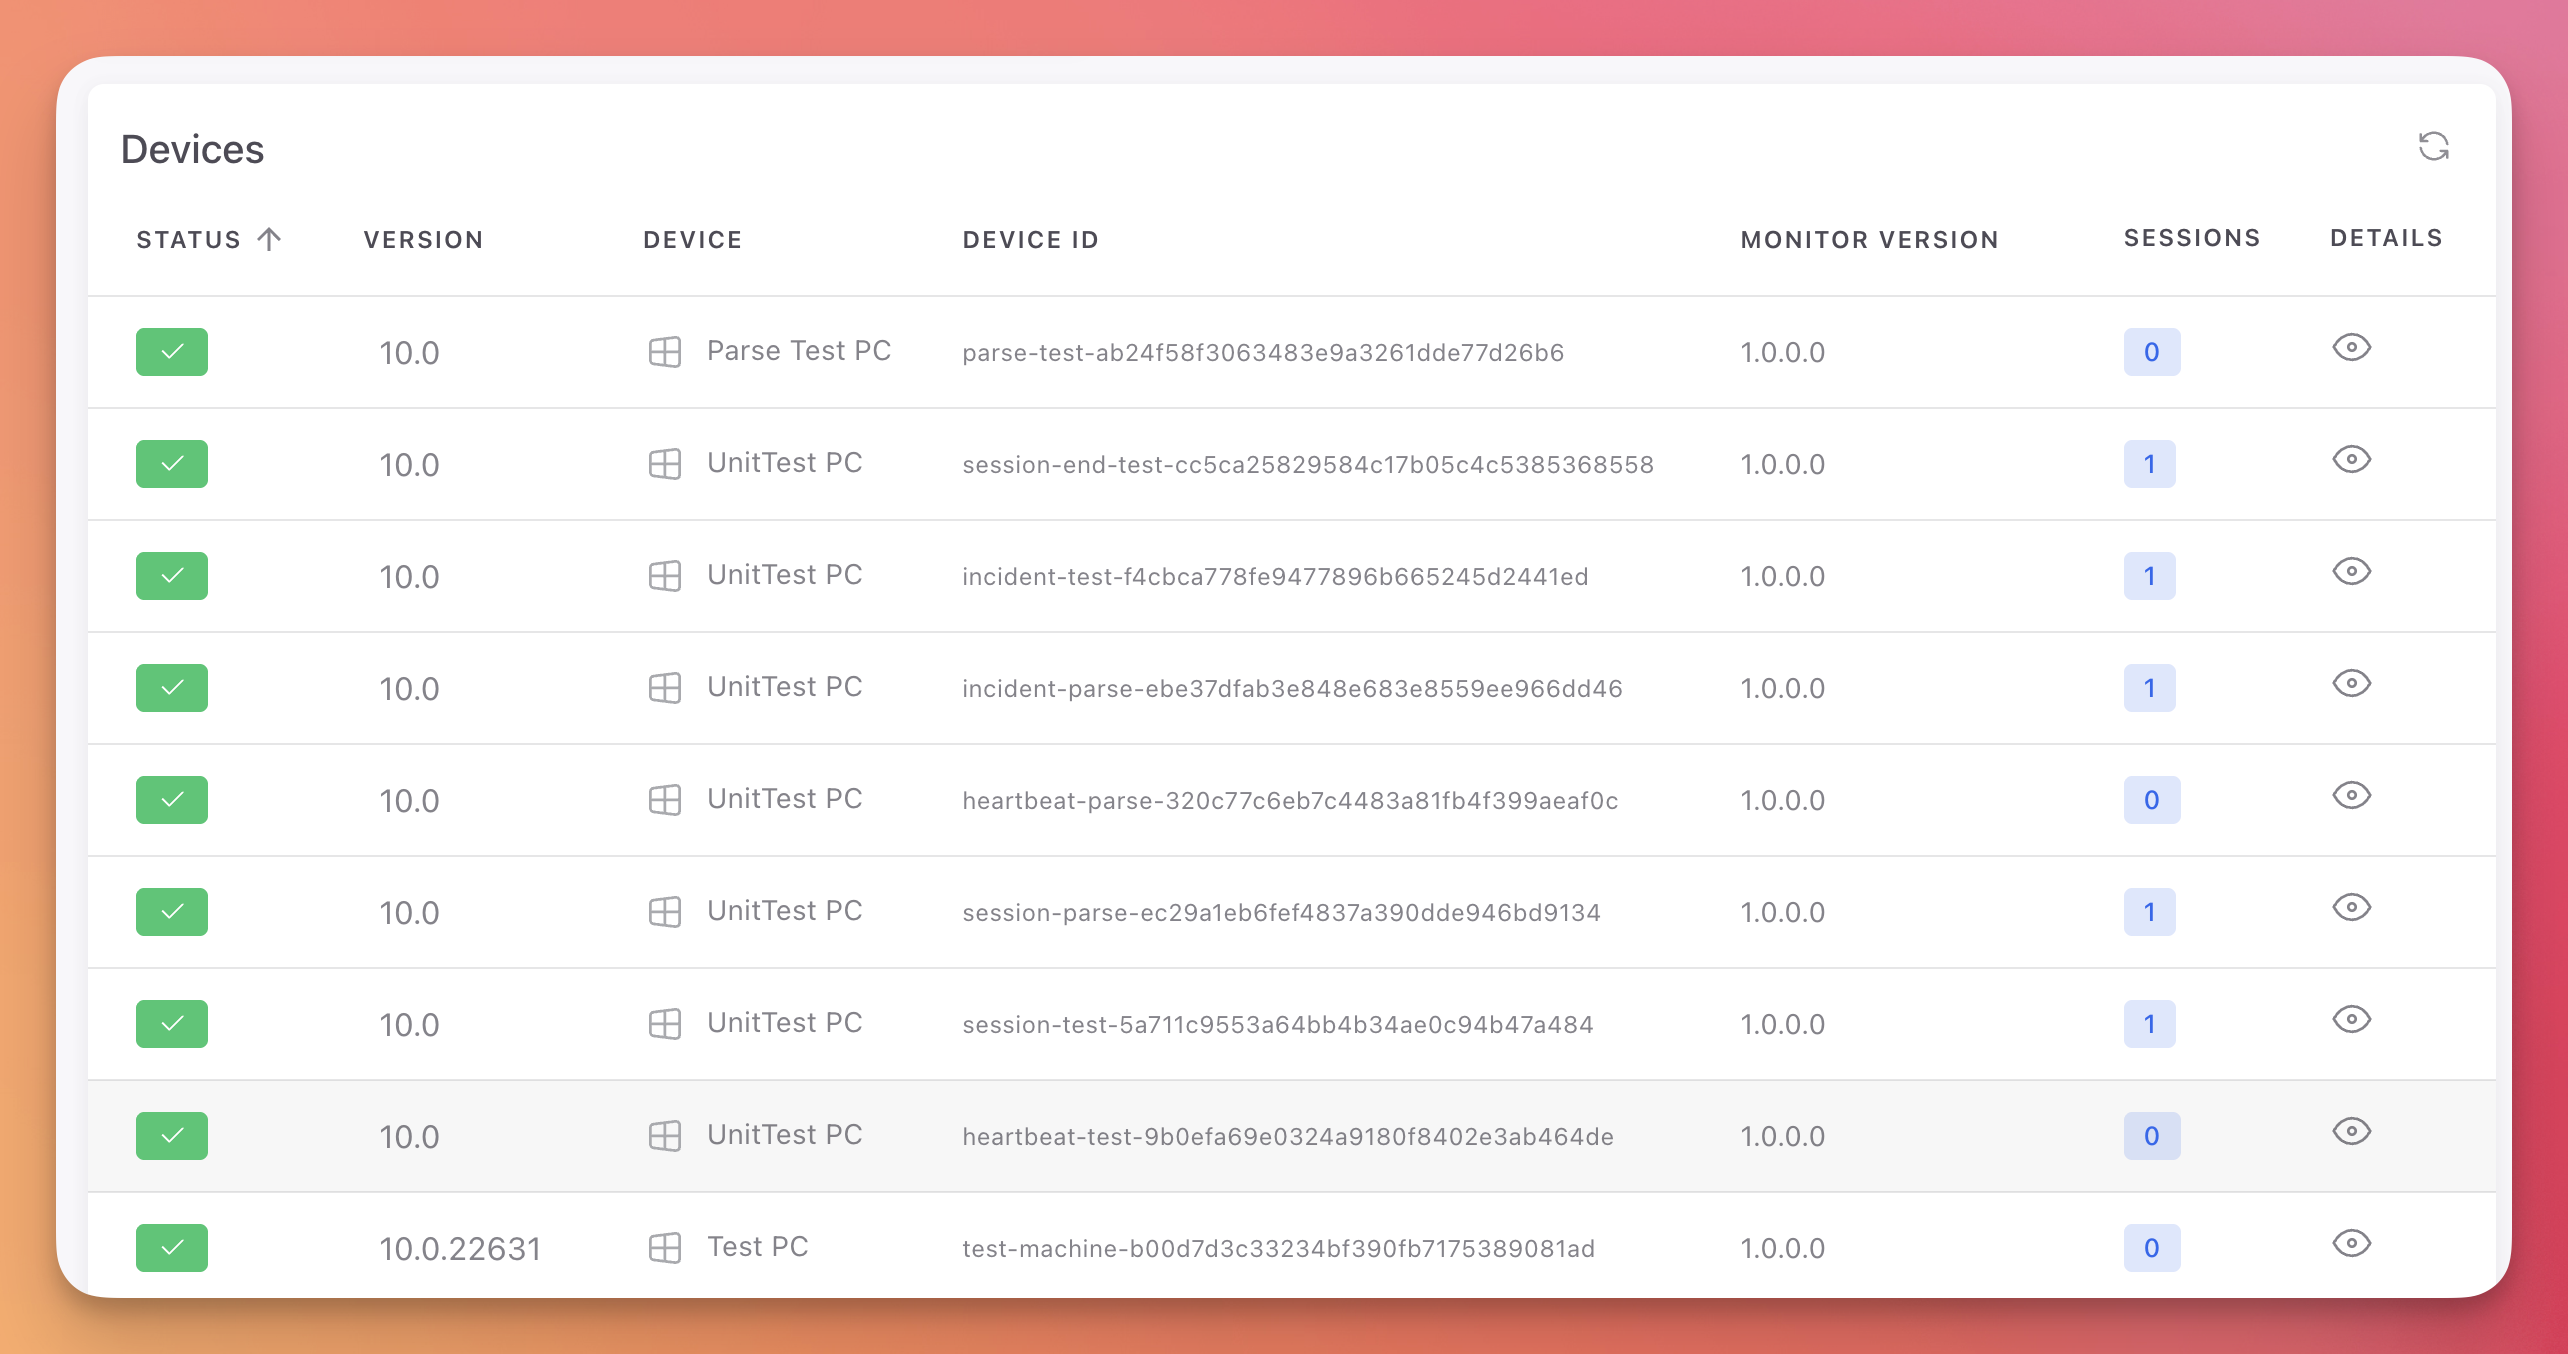
Devices Table
| Column | Description |
|---|---|
| Status | Active (green check) or Blocked (red) |
| Version | Operating system version |
| Device | Device or server name |
| Device ID | Unique device identifier (truncated hash) |
| Monitor Version | Version of the Monitor SDK installed |
| Sessions | Number of sessions recorded for this device (badge with count) |
| Blocked | Whether the device is currently blocked (red X if blocked) |
| Details | View button to open the device detail page |
Device Details
Click the view button on any device row to open its detail page.
 Click to expand
Information Cards
Last Session Info:
- Session ID, IP address, uptime
- Country (with flag) and city
- Interactive map showing the device location
Device Info:
- IPv4 and IPv6 addresses, uptime, country
App Info:
- Application version and Monitor SDK version
Security Status
Six security checks showing the current state of the device:
| Check | Description |
|---|---|
| Virtual Machine | Whether the device is running inside a VM |
| Root Device | Whether the device is rooted or jailbroken |
| Sandbox | Whether the application is running in a sandbox |
| Deobfuscator tools | Whether deobfuscation tools are detected |
| Debugger tools | Whether debugging tools are attached |
| Intercept packages | Whether network interception tools are detected |
Each check shows a green checkmark (safe) or a red warning (detected).
Device Actions
Actions you can take on a specific device:
| Action | Description |
|---|---|
| Clear Memory | Remotely clear sensitive data from the device's application memory |
| Delete Files | Remotely wipe application files on the device |
| Block Device | Add the device to the firewall blocklist, preventing further connections |
| Unblock Device | Remove the device from the firewall blocklist |
Sessions Table
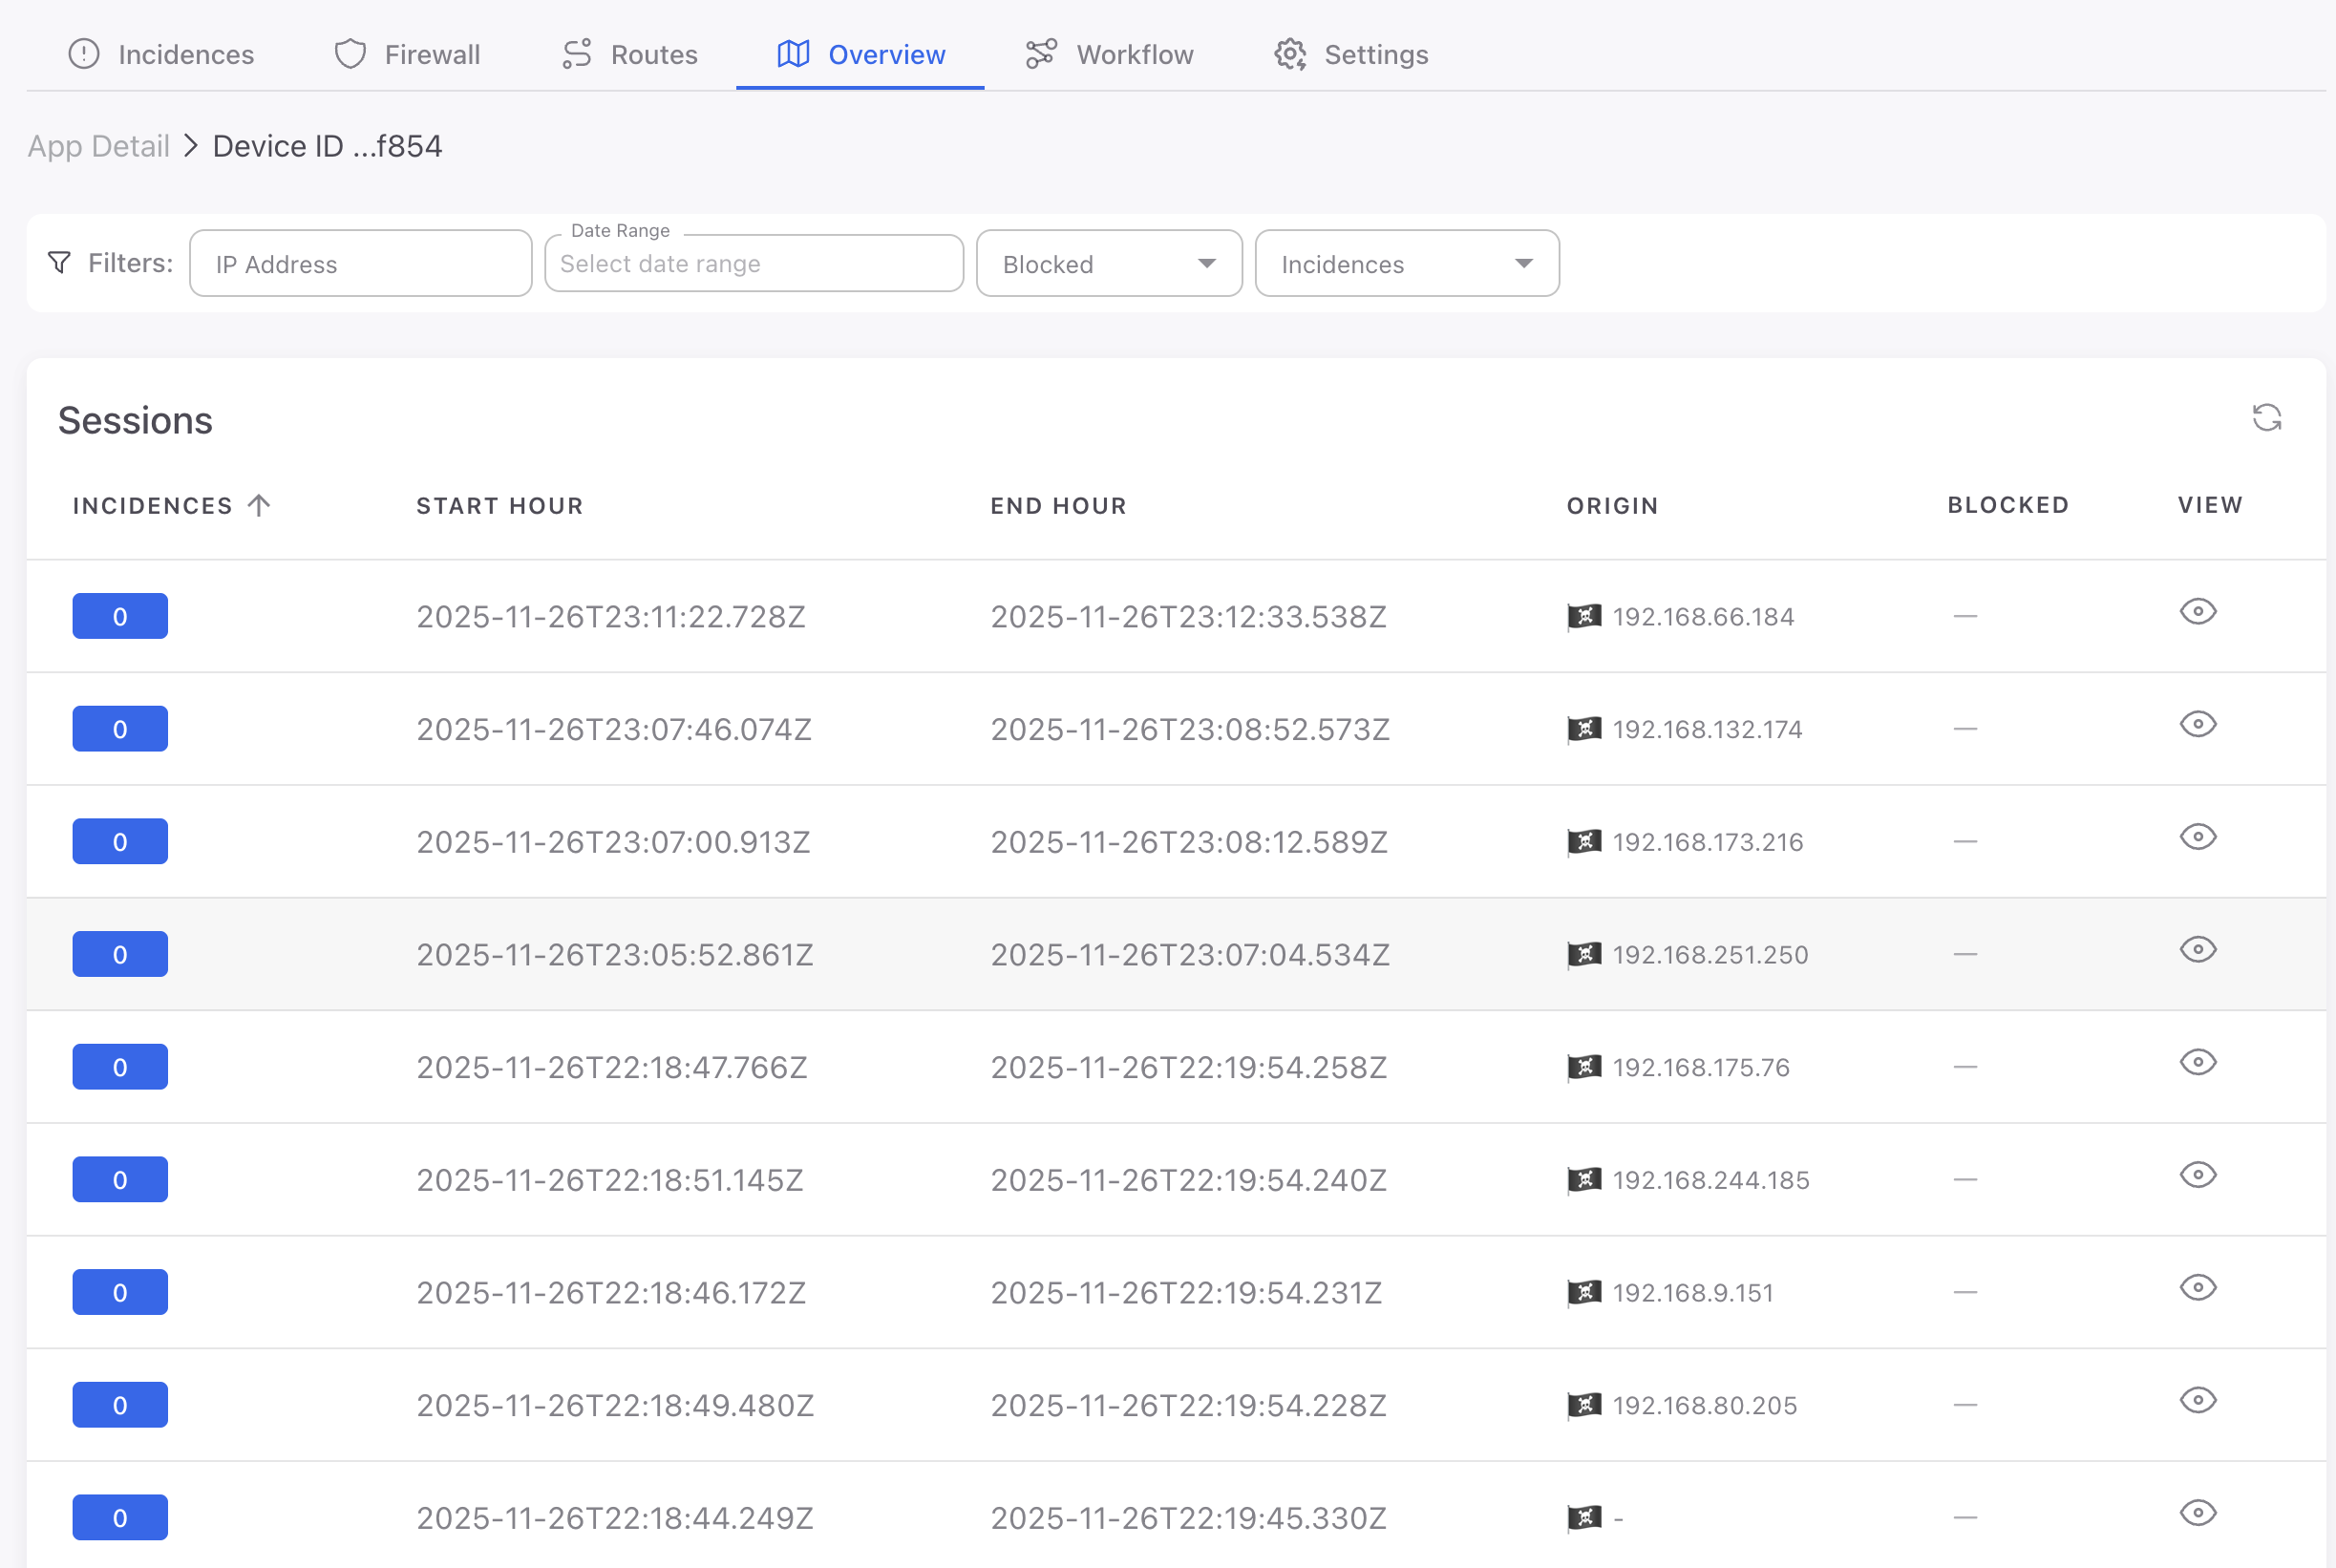
Below the device information, a table lists all sessions recorded for this device:
| Column | Description |
|---|---|
| Incidences | Number of incidents in the session. Green badge (0) for clean sessions, orange badge (1+) for sessions with threats |
| Start Hour | Session start timestamp |
| End Hour | Session end timestamp |
| View | View button to open the session detail page |
Filters: IP Address, Date Range, Incidences.
Session Details
Click any session row to open the session detail page with a full timeline of events.
 Click to expand
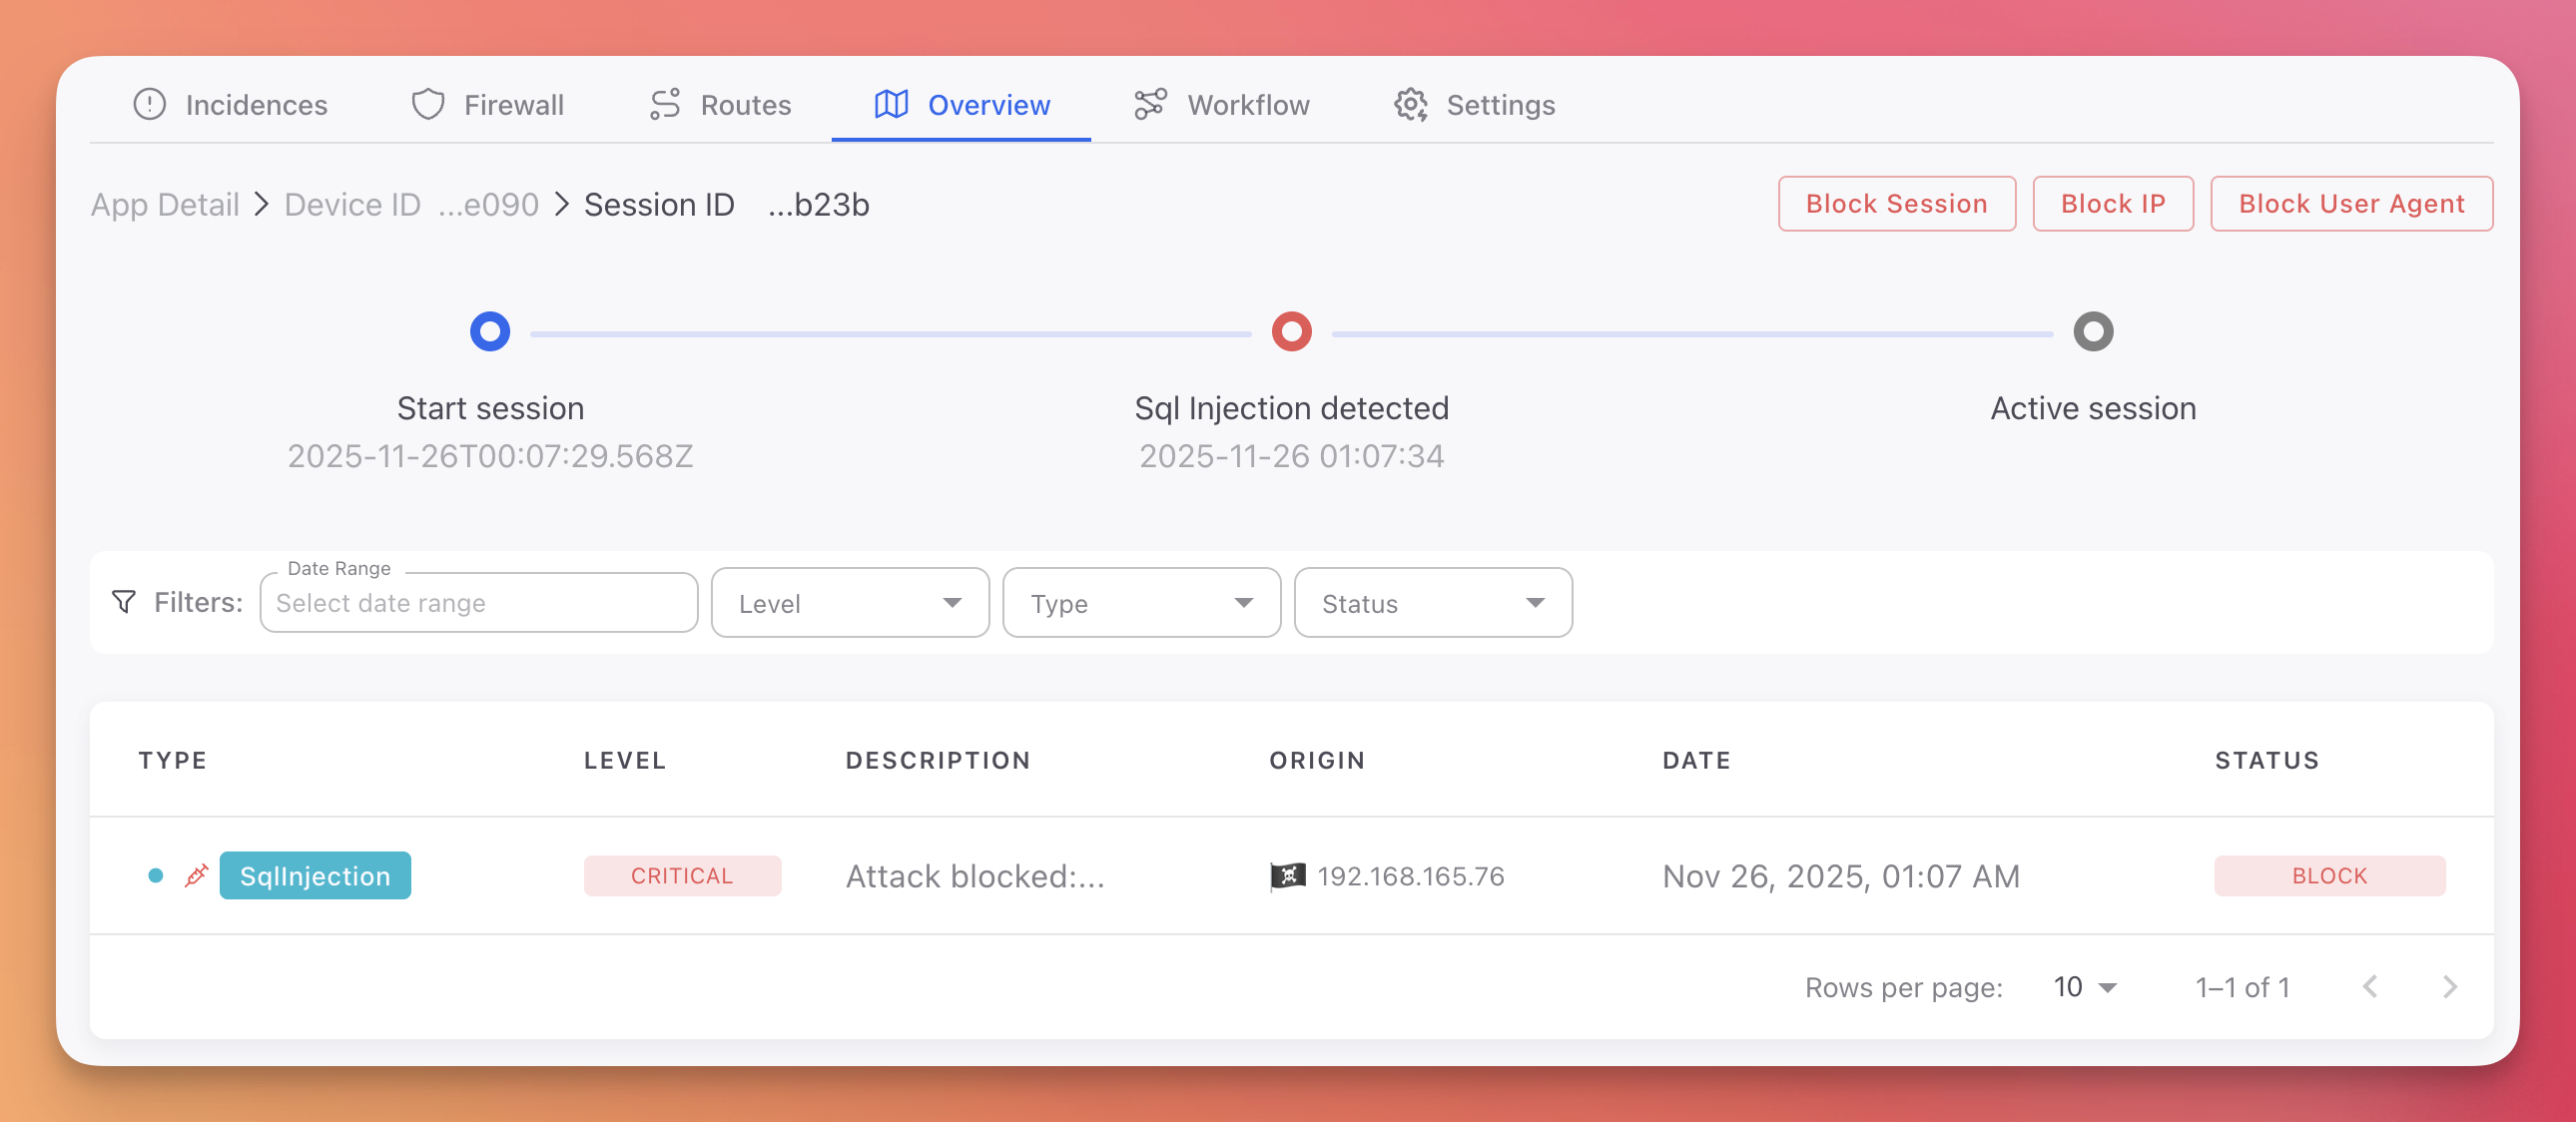
Session Timeline
A visual horizontal timeline showing:
- Start session (blue): When the session began, with timestamp
- Threat detected (red): Each security incident during the session, with protection module name and timestamp
- End session (blue): When the session ended, with timestamp
Session Actions
Two actions available at the top of the session detail page:
- Block Session: Invalidate this session immediately
- Block User Agent: Block the user agent string associated with this session
Session Incidences Table
A filtered table showing only the incidents that occurred during this specific session, with the same columns as the main Incidences table: Type, Level, Description, Origin, Date, and Status.
Filters: Date Range, Level, Type, Status.
Next Steps
Incidences
View all detected threats with AI-powered analysis
Firewall
Manage device, IP, and user agent blocklists
Settings
Configure session duration and manage project token