Incidences
View all detected security threats in real-time. Every incident includes full context: severity, payload, origin, stacktrace, and AI-powered analysis.
Incidences Dashboard
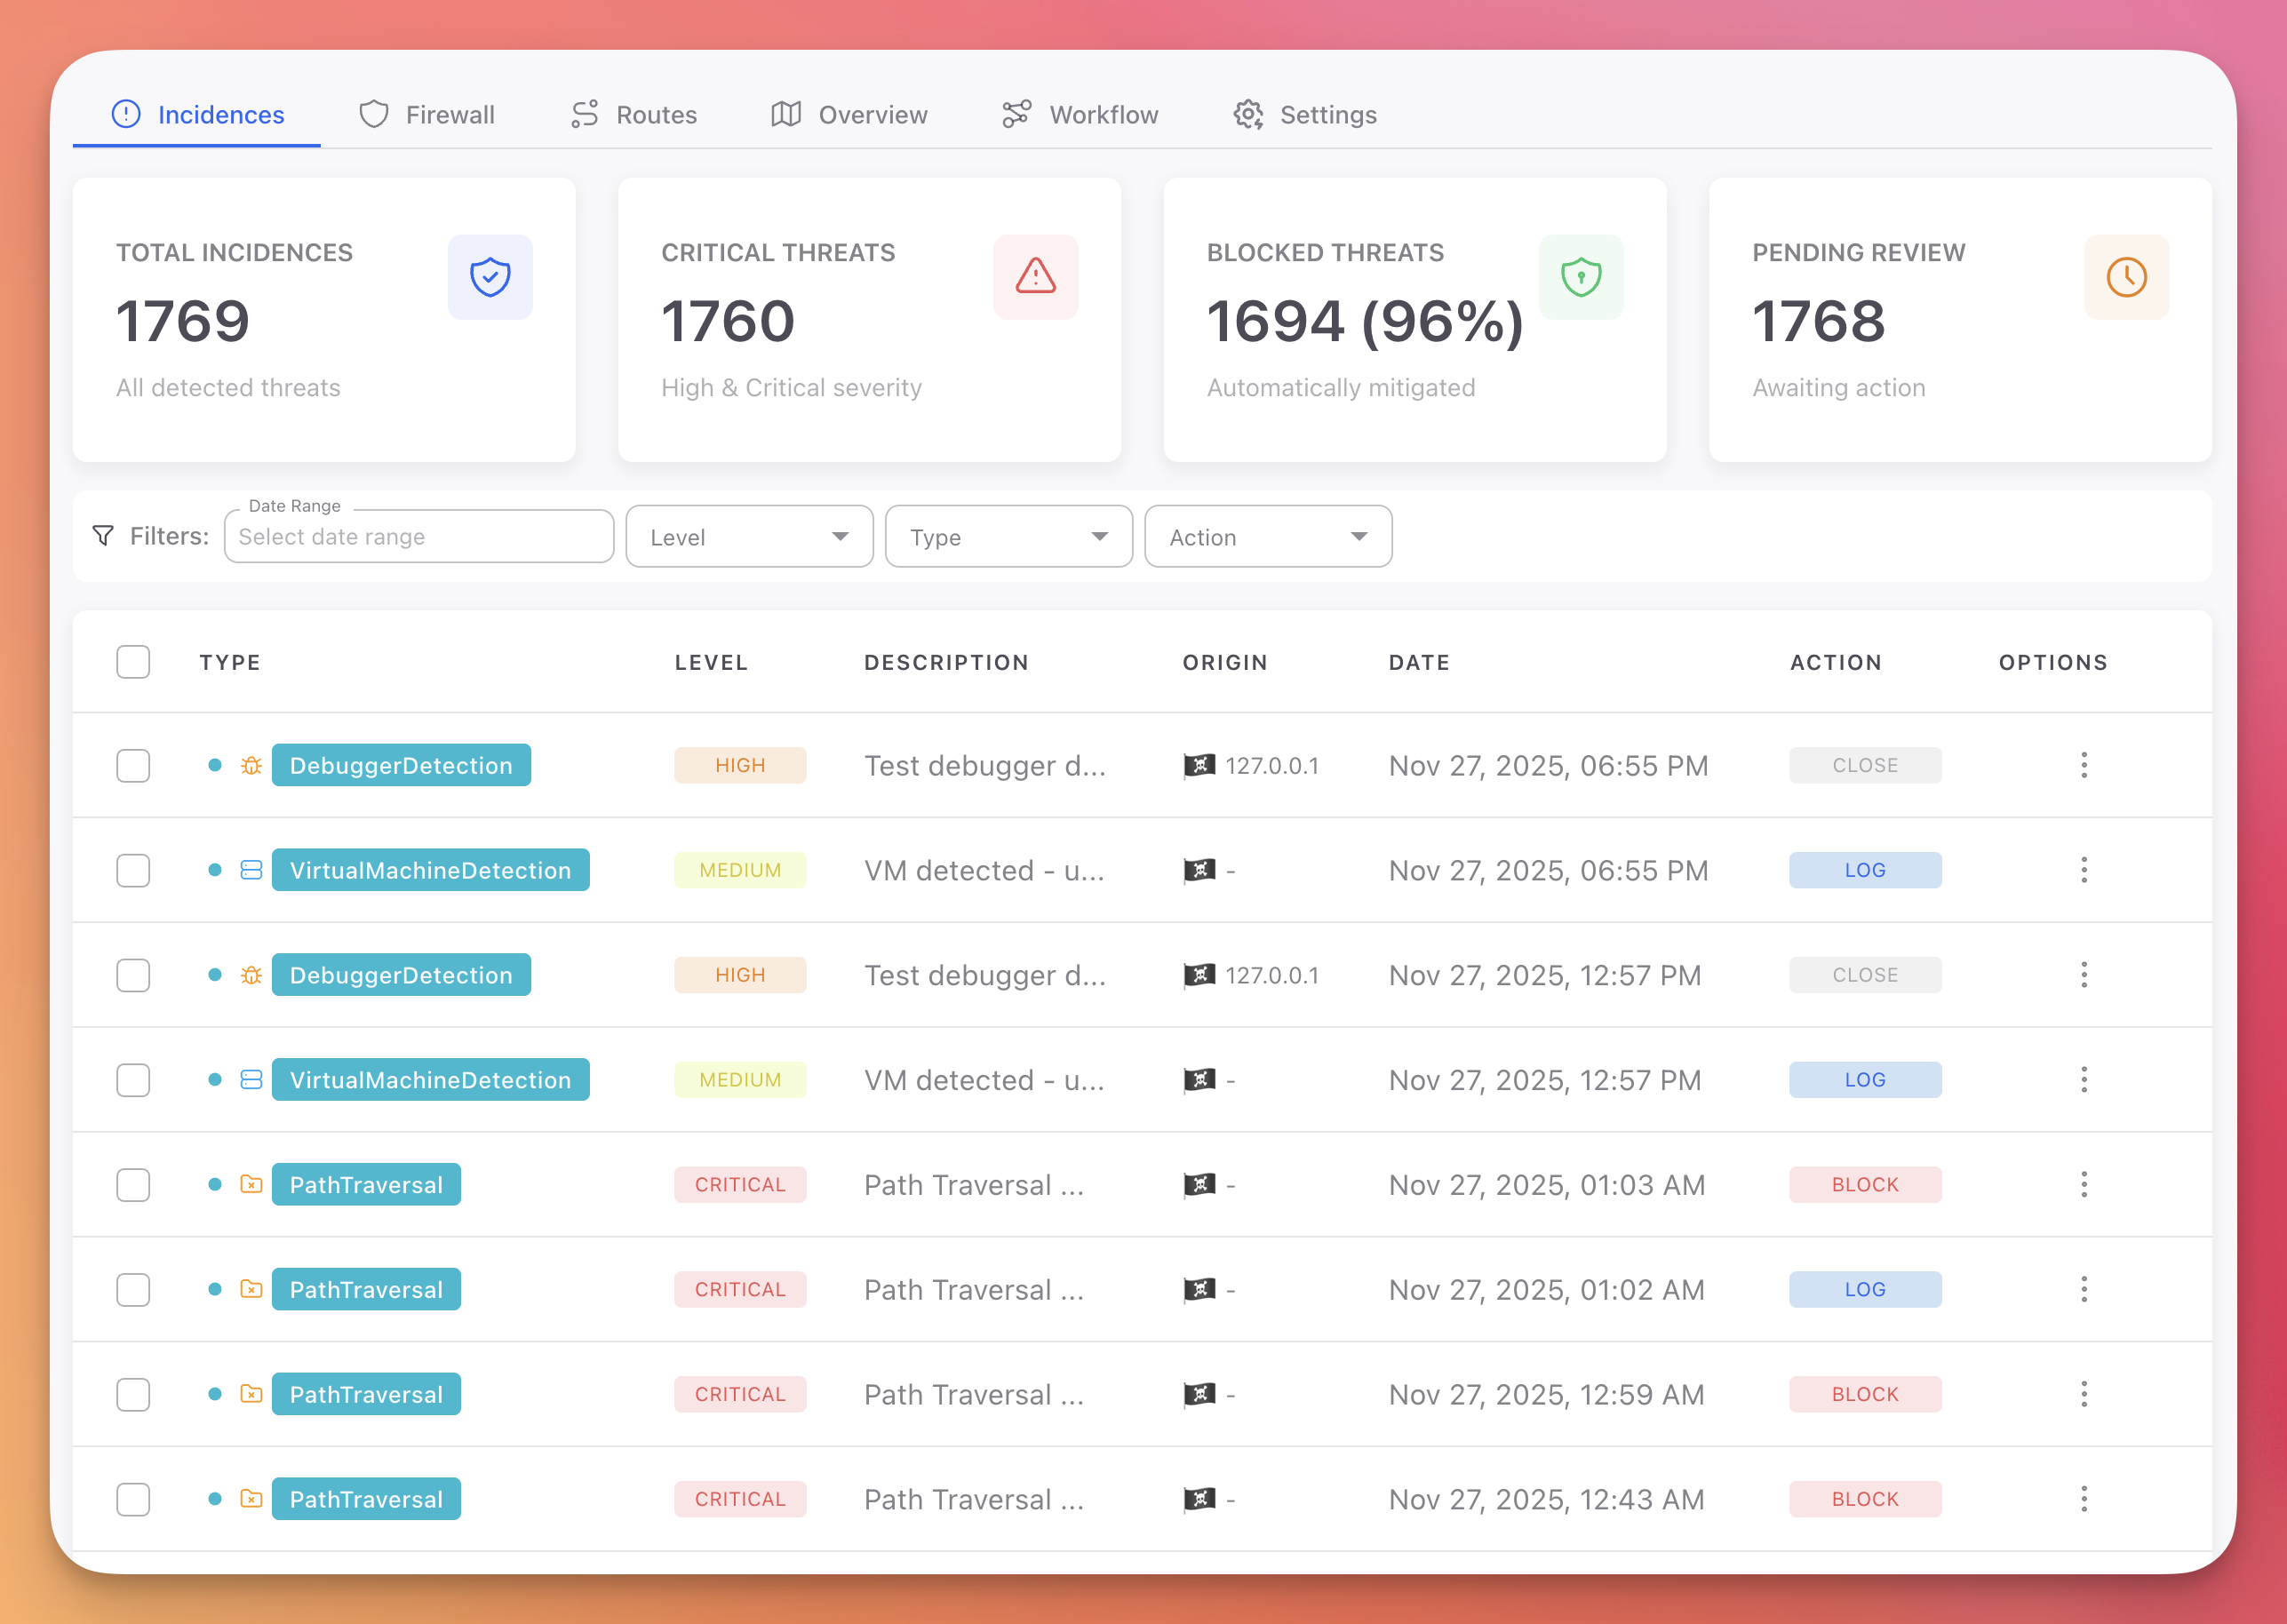
The Incidences tab shows all threats detected across every device and session running your application.
 Click to expand
Statistics Cards
Four cards at the top summarize your current security status:
| Card | Description |
|---|---|
| Total Incidences | Total number of detected threats |
| Critical Threats | Incidents classified as High or Critical severity |
| Blocked Threats | Percentage of threats that were automatically mitigated (Block, Close, Erase) |
| Pending Review | Incidents awaiting manual review |
Incidences Table
Each row represents a detected threat with the following columns:
| Column | Description |
|---|---|
| Type | Protection module that triggered the detection (SqlInjection, DebuggerDetection, PathTraversal, etc.) with a color-coded badge |
| Level | Severity badge: Critical (red), High (orange), Medium (yellow) |
| Description | Summary of the detected threat |
| Origin | Source IP address with platform icon |
| Date | Timestamp of when the threat was detected |
| Action | Action that was executed: Log (green), Block (red), Close (grey) |
| Options | Menu with Mark as Read and Delete |
Filters
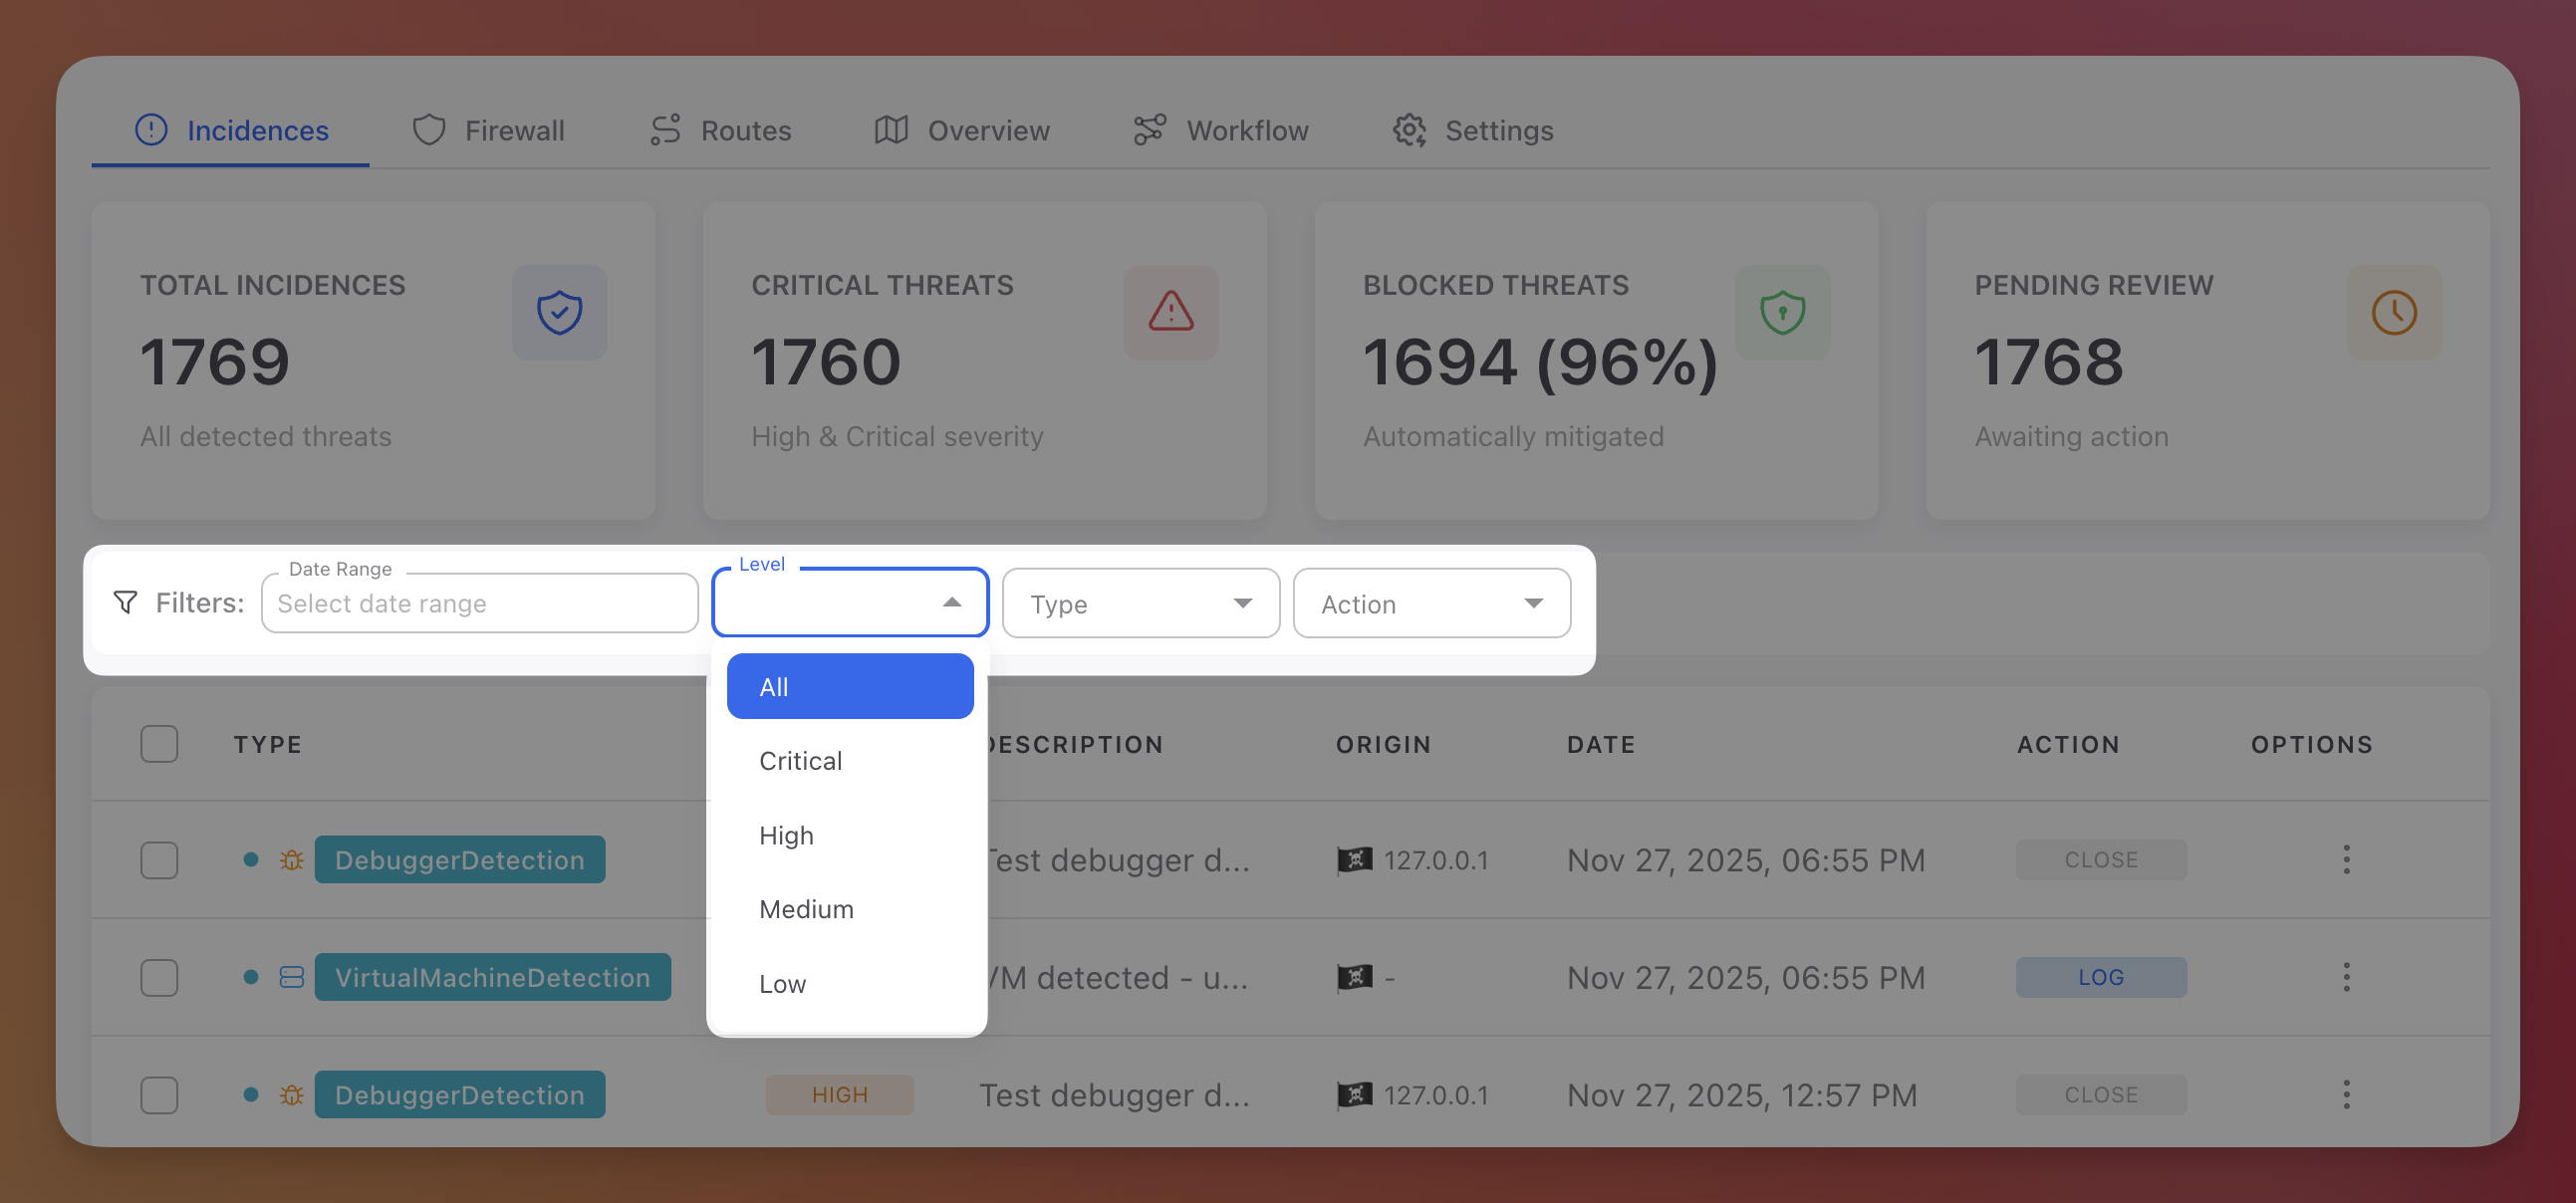
Use the filter bar above the table to narrow down incidents:
 Click to expand
| Filter | Options |
|---|---|
| Date Range | Custom date range picker |
| Level | Critical, High, Medium, Low |
| Type | All protection modules: Command Injection, Cross-Site Scripting (XSS), LDAP Injection, LLM Prompt Injection, NoSQL Injection, Path Traversal, SQL Injection, SSRF, XXE, and all desktop/mobile modules |
| Action | All, Block, Close, Log |
Incident Details
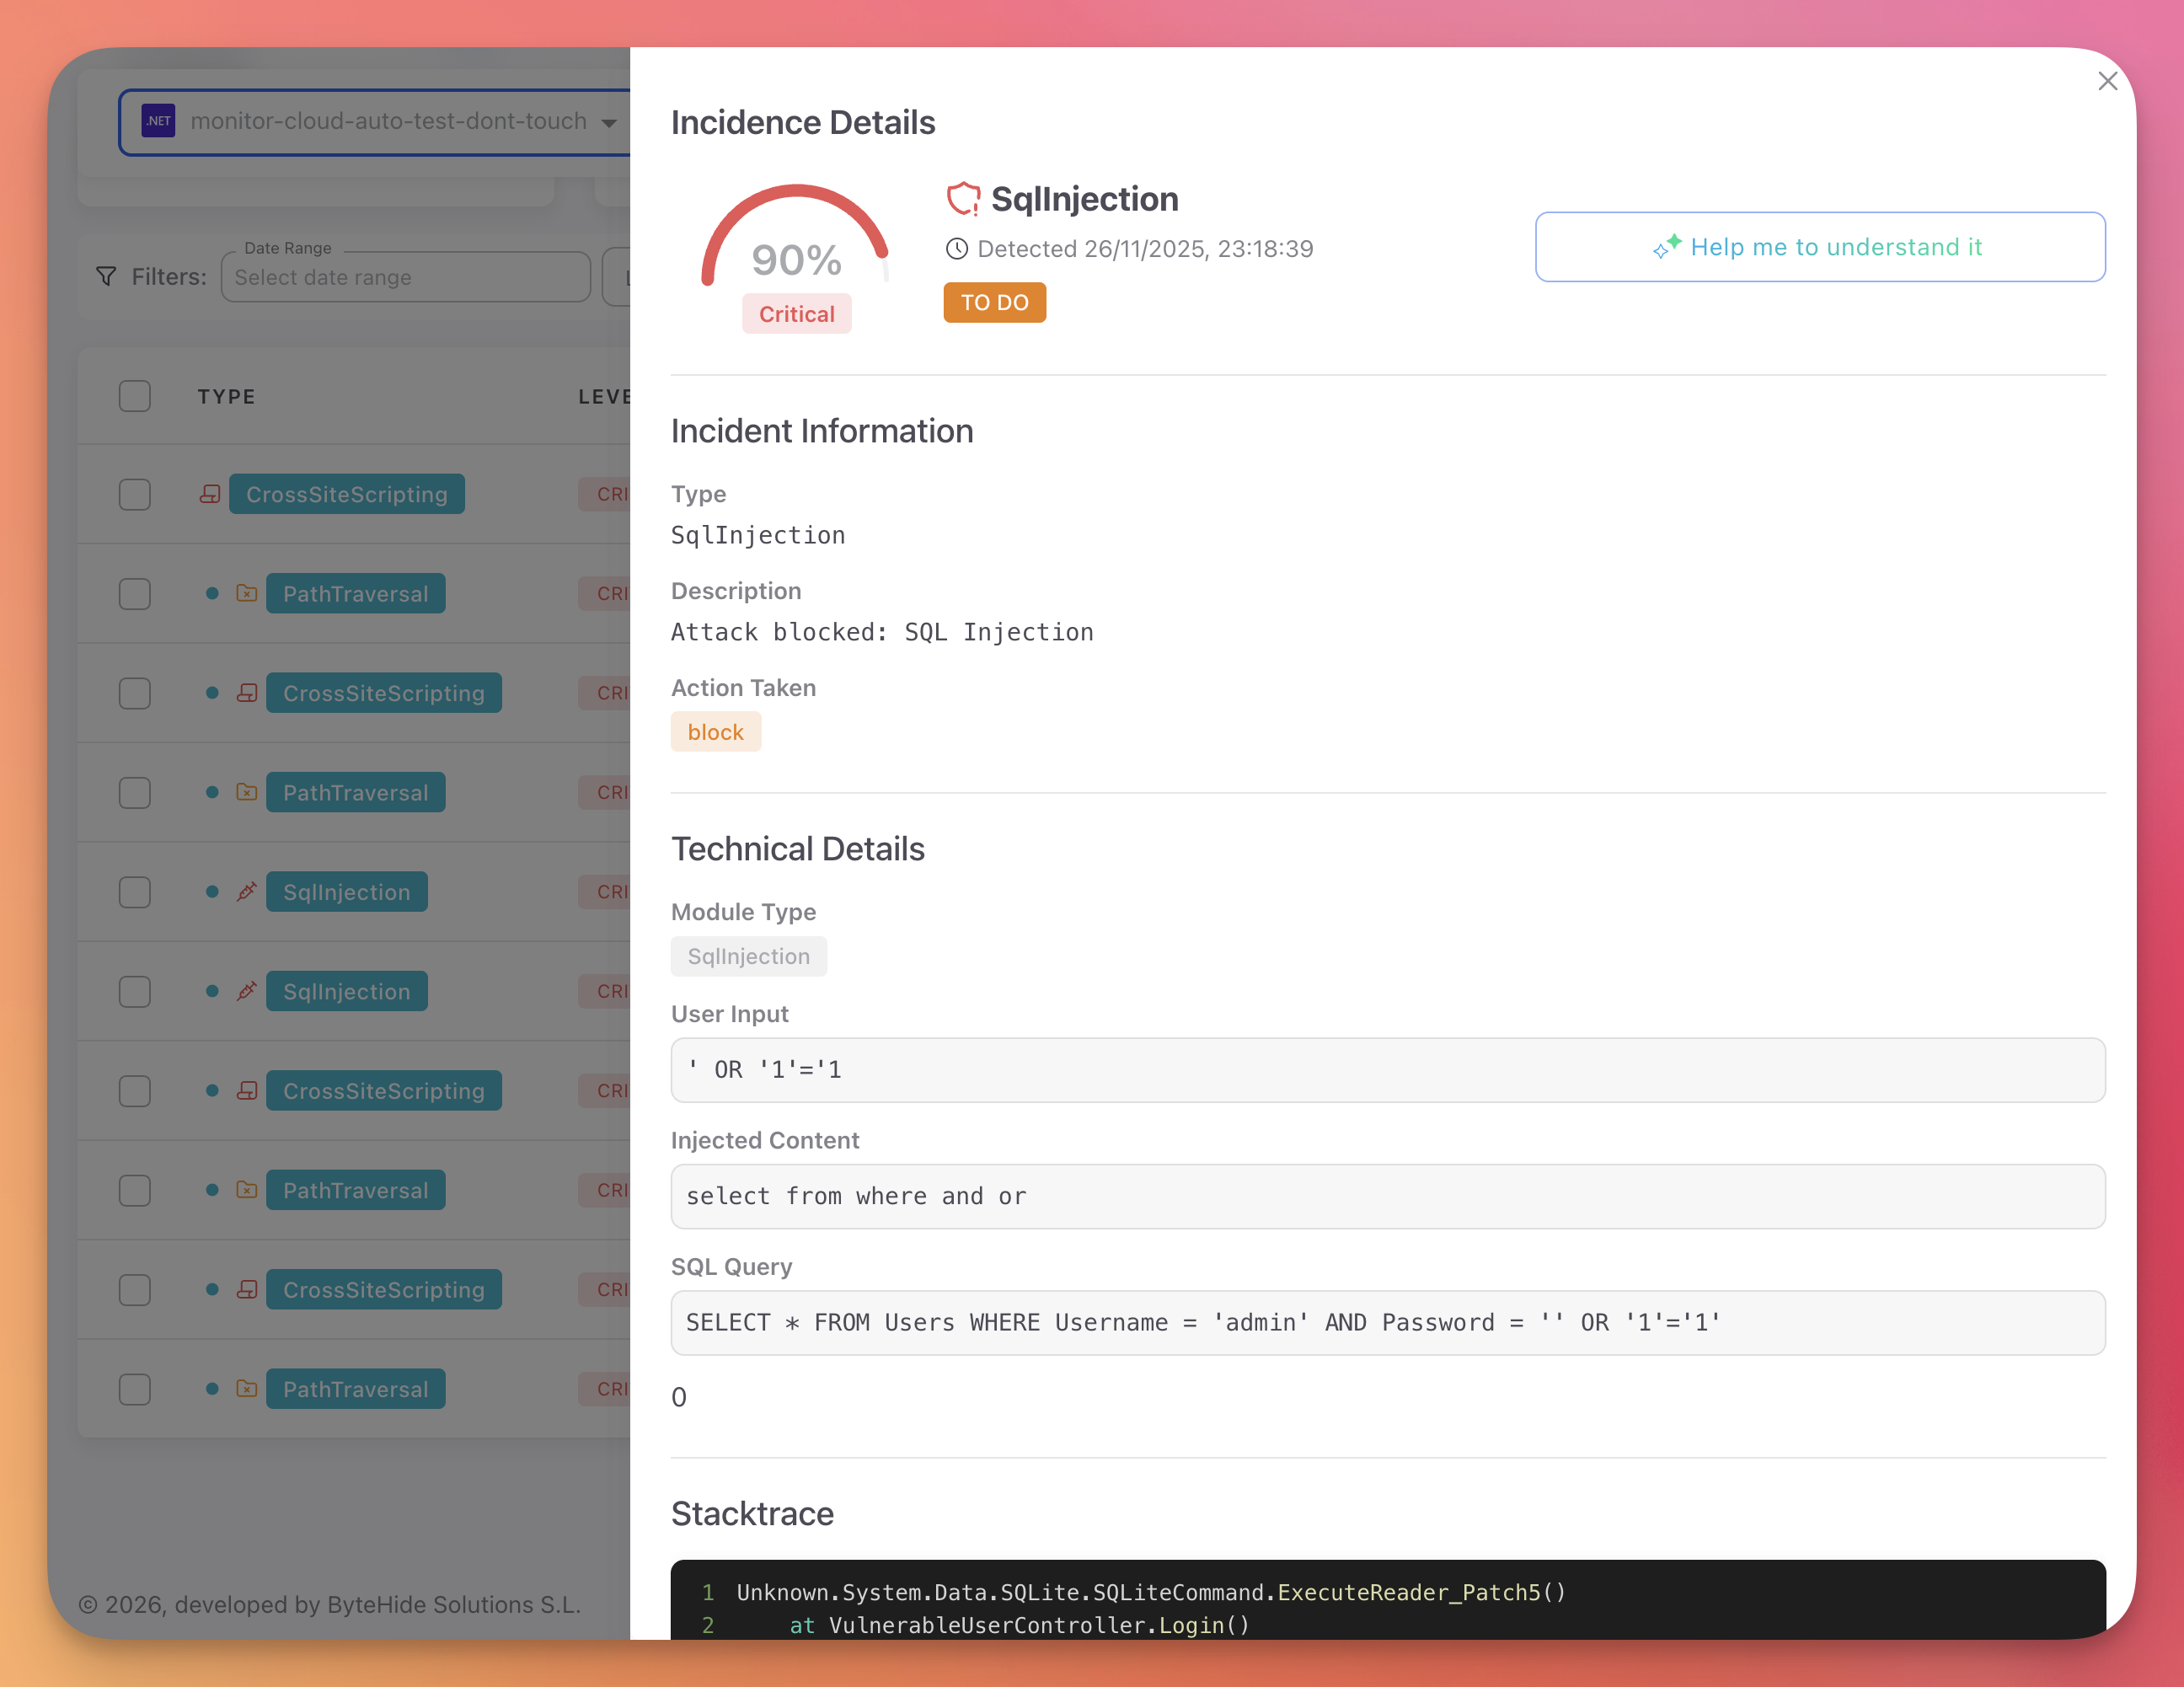
Click any incident row to open the detail panel with full forensic context.
 Click to expand
Incident Information
The header displays:
- Confidence gauge: Semicircular gauge showing the detection confidence percentage (e.g., 90%)
- Severity label: Critical, High, Medium, or Low
- Protection module: The type of threat detected (e.g., SqlInjection)
- Detection timestamp
- Status badge: Current status of the incident (e.g., TO DO)
- "Help me to understand it" button: Opens the AI Security Analysis
Technical Details
The technical details vary depending on the protection module type.
Web protection example (SQL Injection):
| Field | Example |
|---|---|
| Module Type | SqlInjection |
| User Input | ' OR '1'='1 |
| Injected Content | select from where and or |
| SQL Query | SELECT * FROM Users WHERE Username = 'admin' AND Password = '' OR '1'='1' |
Desktop protection example (Debugger Detection):
| Field | Example |
|---|---|
| Module Type | DebuggerDetection |
| Payload | Debugger type and detection method |
Stacktrace
A code block showing the execution call chain at the time of detection. This shows exactly which code path was executing when the threat was intercepted, from the Monitor interception point back to the application entry point.
Origin Information
| Field | Description |
|---|---|
| IP Address | Source IP of the request or device |
| Device | Device or server name |
| User Agent | Full user agent string |
| Device ID | Unique device identifier |
| Platform | Application platform (web, mobile, desktop) |
| Session ID | Session identifier (for tracking related incidents) |
Tip
Review the stacktrace and payload to understand the attack vector. Consider implementing additional validation and sanitization measures for the affected code path.
AI Security Analysis
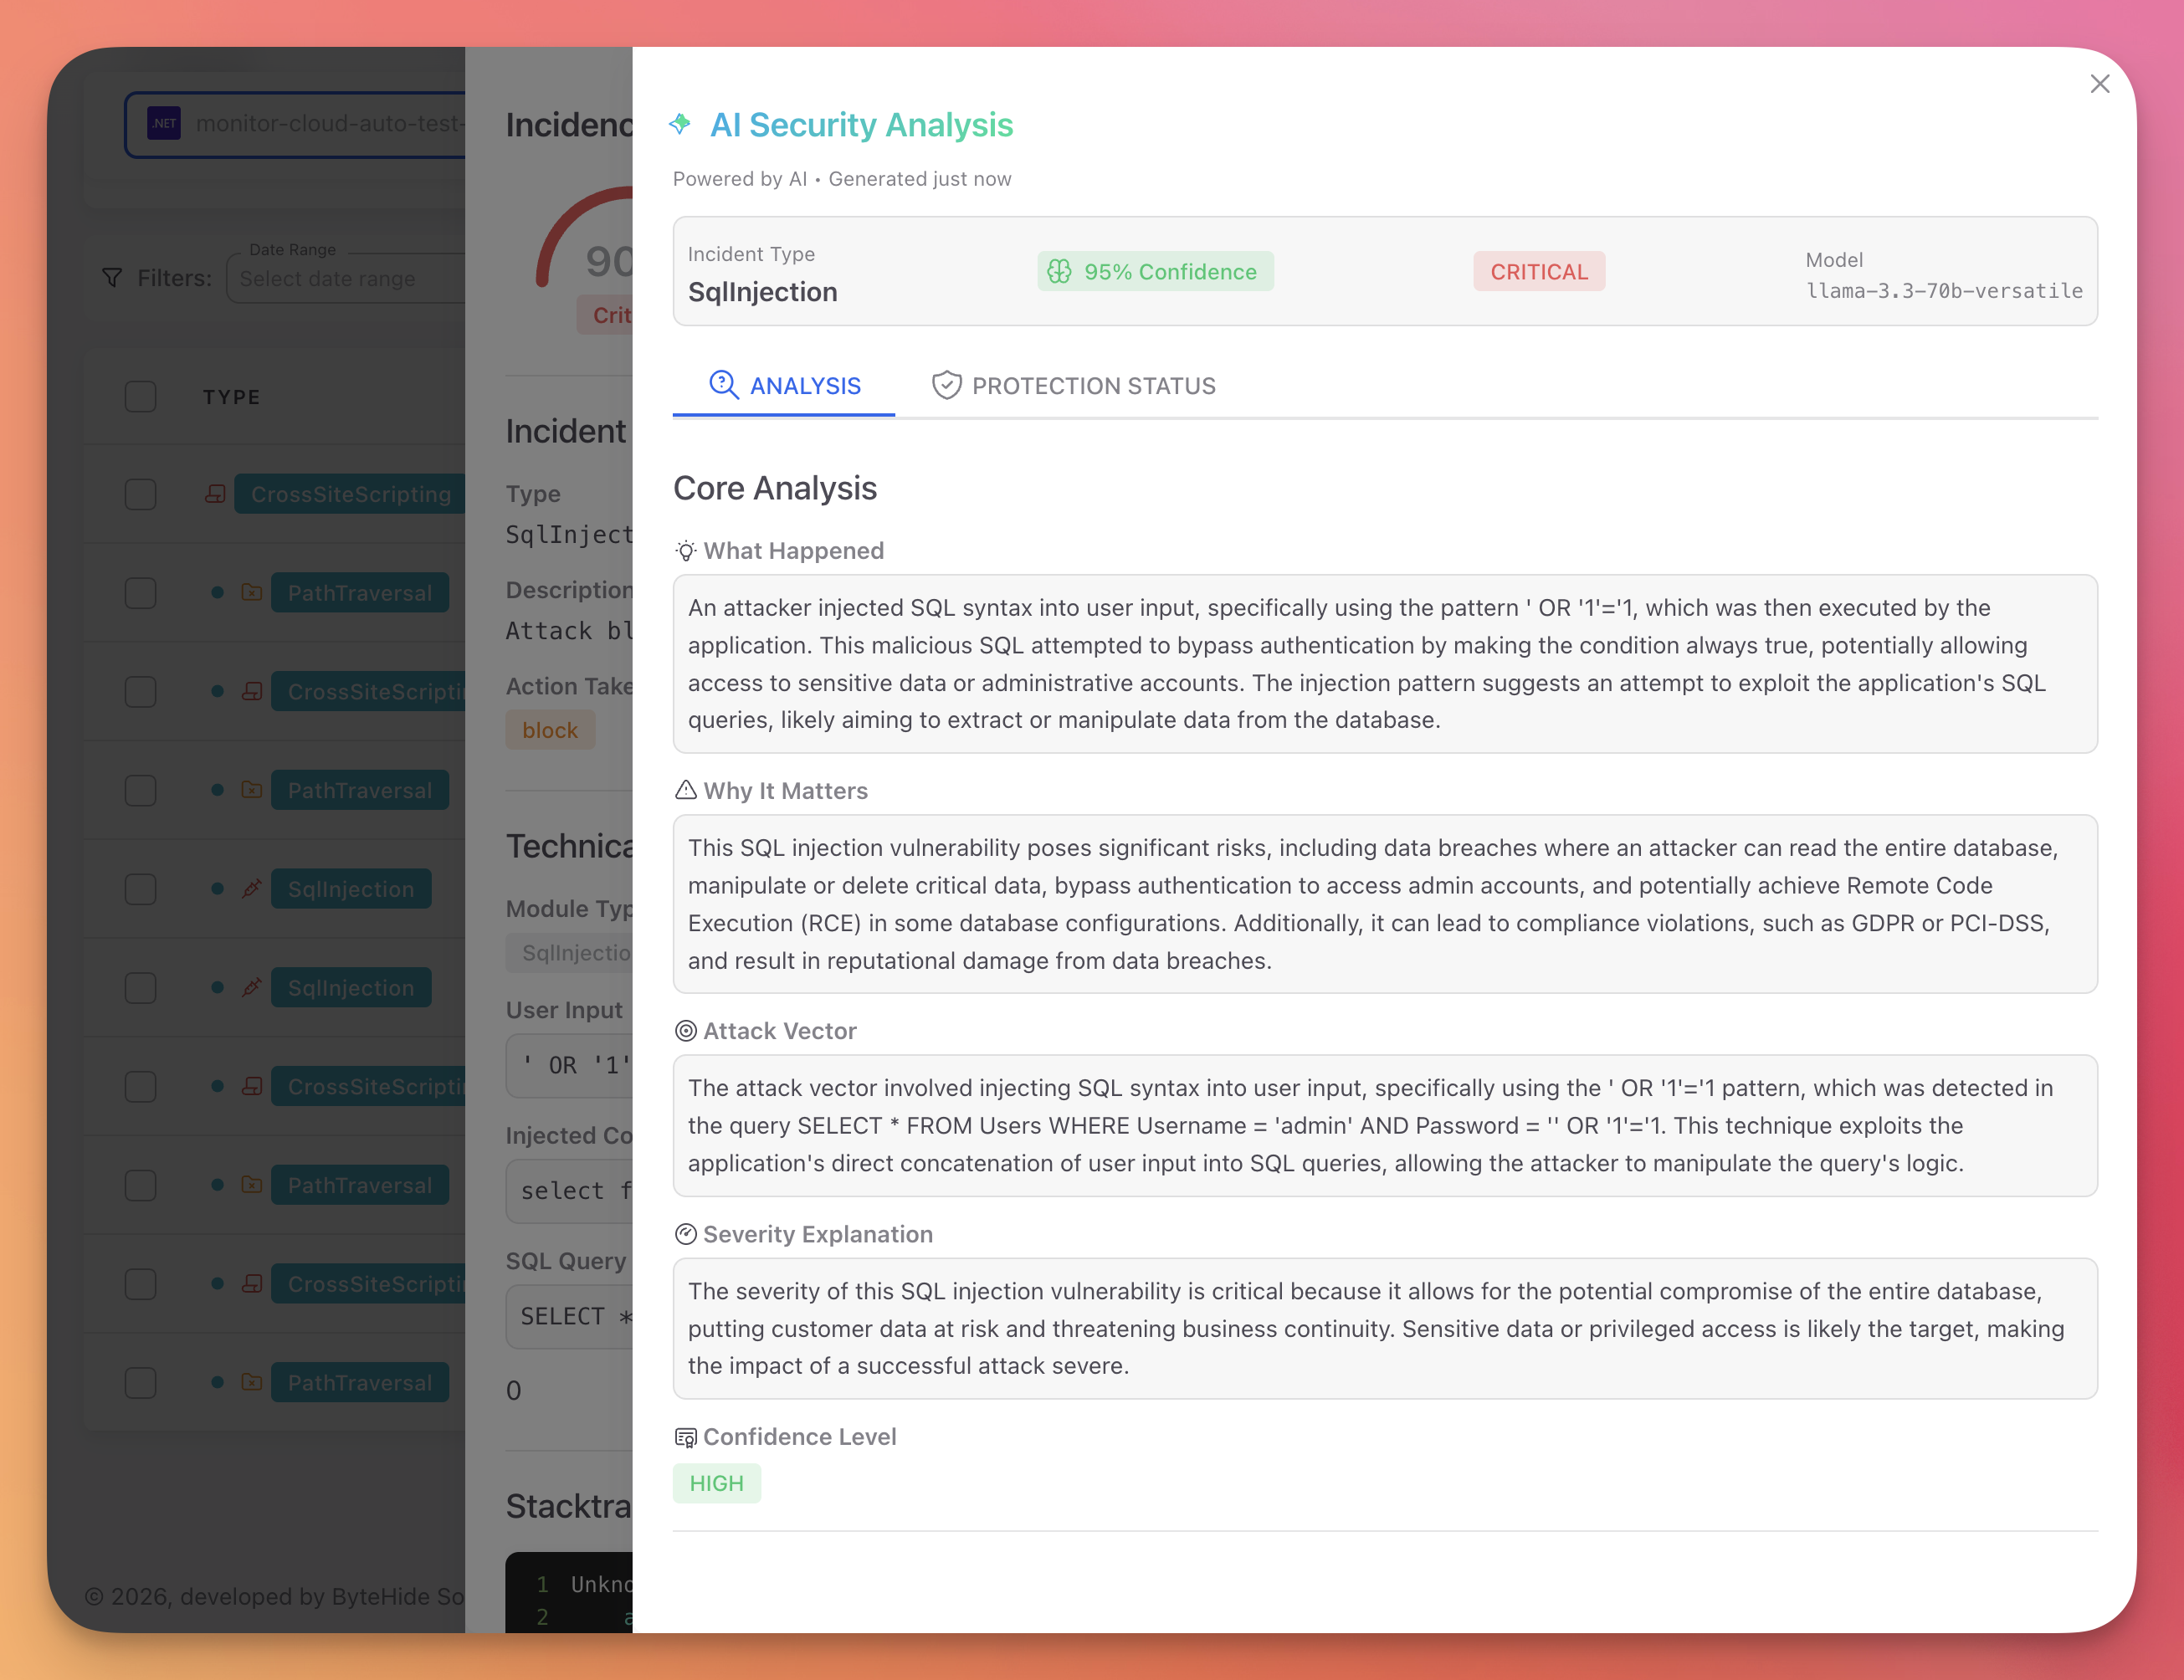
Click "Help me to understand it" on any incident to get an AI-powered explanation of the threat.
 Click to expand
Analysis Tab
| Section | Description |
|---|---|
| What Happened | Plain-language explanation of the attack |
| Why It Matters | Potential business impact: data breaches, compliance violations, reputational damage |
| Attack Vector | Technique used, entry point, and why it worked |
| Severity Explanation | Why the incident is rated at its severity level |
| Confidence Level | AI model confidence in the analysis (High, Medium, Low) |
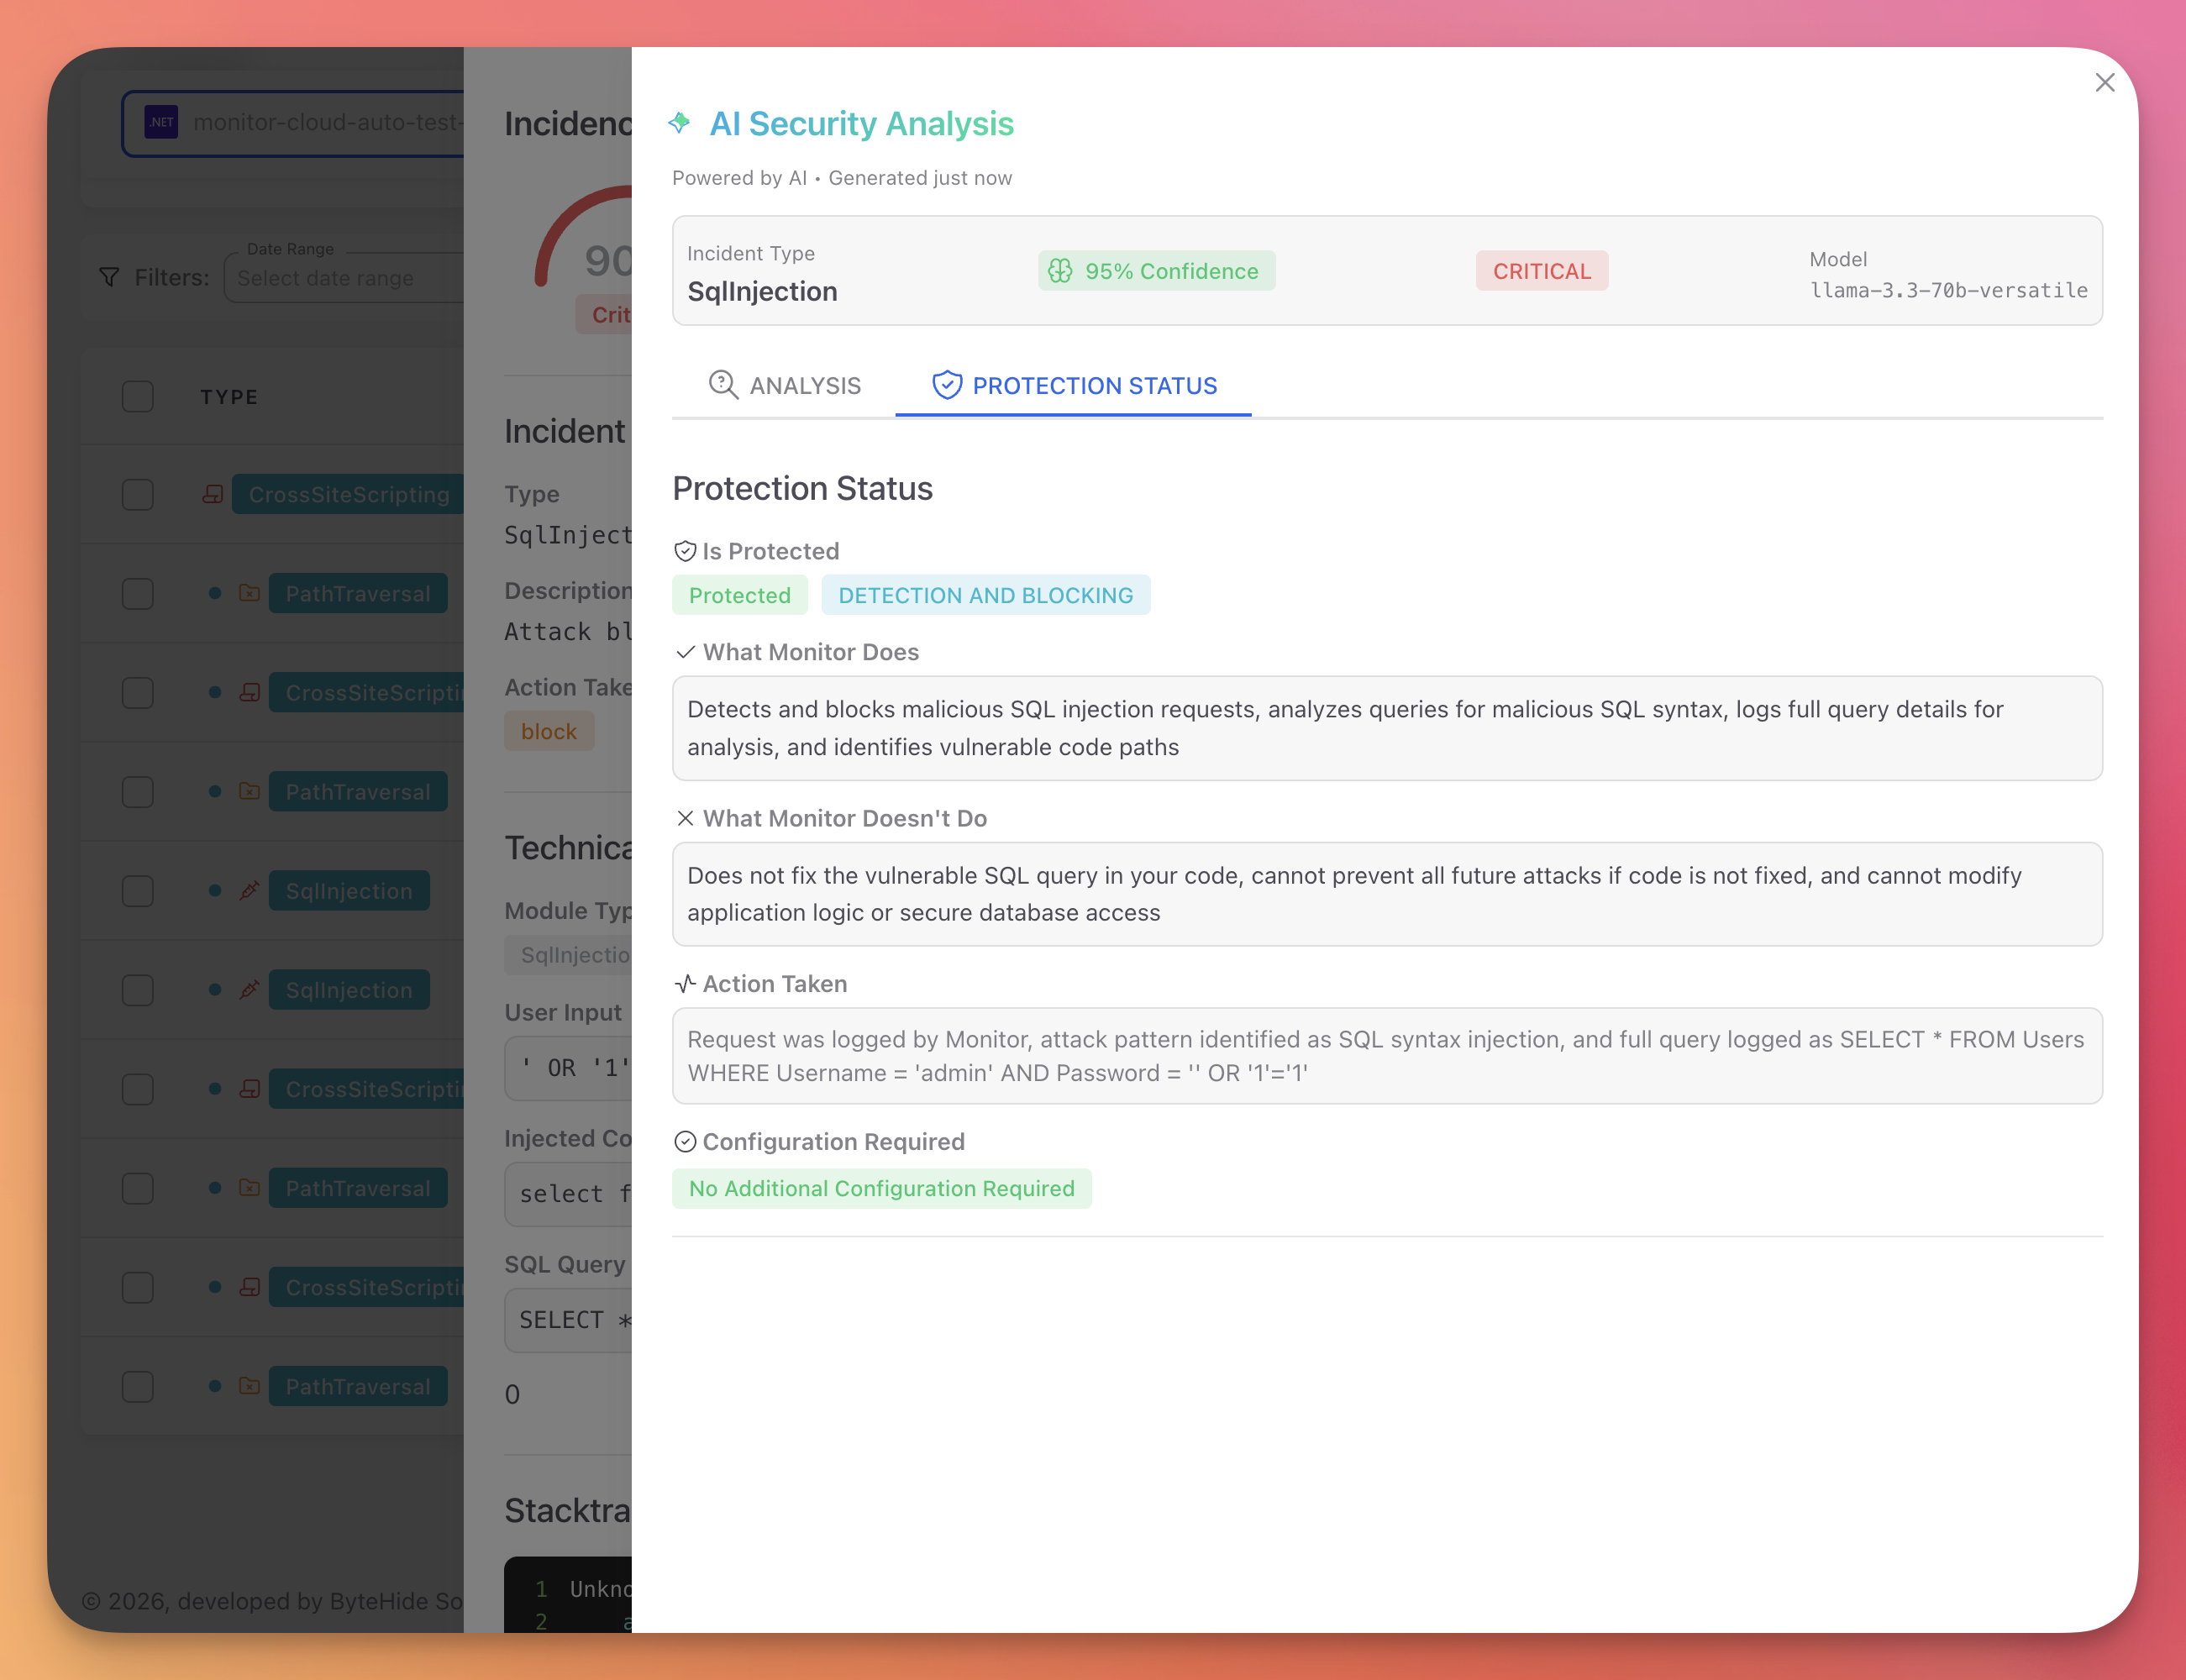
Protection Status Tab
 Click to expand
| Section | Description |
|---|---|
| Is Protected | Whether the application is fully protected, partially protected, or in detection-only mode |
| What Monitor Does | Capabilities of Monitor for this type of threat |
| What Monitor Doesn't Do | Limitations (Monitor does not fix code, does not modify application logic) |
| Action Taken | Detailed description of the response action that was executed |
| Configuration Required | Whether additional configuration is needed to improve protection |
Incident Actions
Each incident row has an options menu (three dots) with:
- Mark as Read: Removes the incident from the Pending Review count
- Delete: Permanently removes the incident from the dashboard
Next Steps
Workflow Rules
Configure automatic responses to detected threats
Firewall
Block IPs, bots, and threat actors proactively
Devices & Sessions
Track devices and drill into session timelines
Protection Modules
All available protection modules that generate incidents