Monitor Logging
Configure how Monitor logs security events, threat detections, and operational information. Multiple output destinations, configurable log levels, and integration with ByteHide Logs for centralized forensic logging.
Overview
Monitor generates log events for every security-relevant action: protection module initialization, threat detections, response actions taken, cloud sync status, and internal errors. You control what gets logged, at what level, and where the output goes.
Logging can be configured from three sources:
- Cloud Dashboard: Toggle logging settings in the Advanced Configuration panel of the Workflow tab
- JSON file: Define logging in the
loggingobject of your configuration file - Configuration API: Set logging options programmatically in code
Log Levels
Monitor supports five log levels, from most to least verbose:
| Level | Description | When to Use |
|---|---|---|
| Debug | Detailed diagnostic information including internal state | Development and active troubleshooting only |
| Info | General operational events: module loaded, config synced, incident reported | Default for production |
| Warning | Potential issues that do not prevent operation | Staging environments, early detection of misconfigurations |
| Error | Errors that affect functionality but do not stop Monitor | Production minimum recommended level |
| Critical | Severe errors requiring immediate attention | Always logged regardless of configured level |
Set the minimum level to control which events are recorded. For example, setting the level to Warning records Warning, Error, and Critical events, but ignores Debug and Info.
Output Destinations
Console Output
Outputs Monitor events to standard output (stdout). Useful during development and in containerized environments where logs are collected from stdout (Docker, Kubernetes).
{
  "logging": {
    "level": "info",
    "console": true
  }
}
{
"logging": {
"level": "info",
"console": true
}
}File Logging
Writes Monitor events to a log file on disk with automatic rotation. When the log file reaches the configured size limit, it rotates to a backup file.
{
  "logging": {
    "file": {
      "enabled": true,
      "path": "logs/monitor.log",
      "maxSizeMB": 10,
      "maxFiles": 5
    }
  }
}
{
"logging": {
"file": {
"enabled": true,
"path": "logs/monitor.log",
"maxSizeMB": 10,
"maxFiles": 5
}
}
}| Field | Type | Default | Description |
|---|---|---|---|
enabled | boolean | false | Enable file logging |
path | string | "logs/bytehide-monitor.log" | Log file path |
maxSizeMB | number | 10 | Max file size before rotation |
maxFiles | number | 5 | Number of backup files to keep |
ByteHide Logs
Send Monitor events to ByteHide Logs for centralized, immutable, cryptographically secured logging. This is the recommended option for production environments.
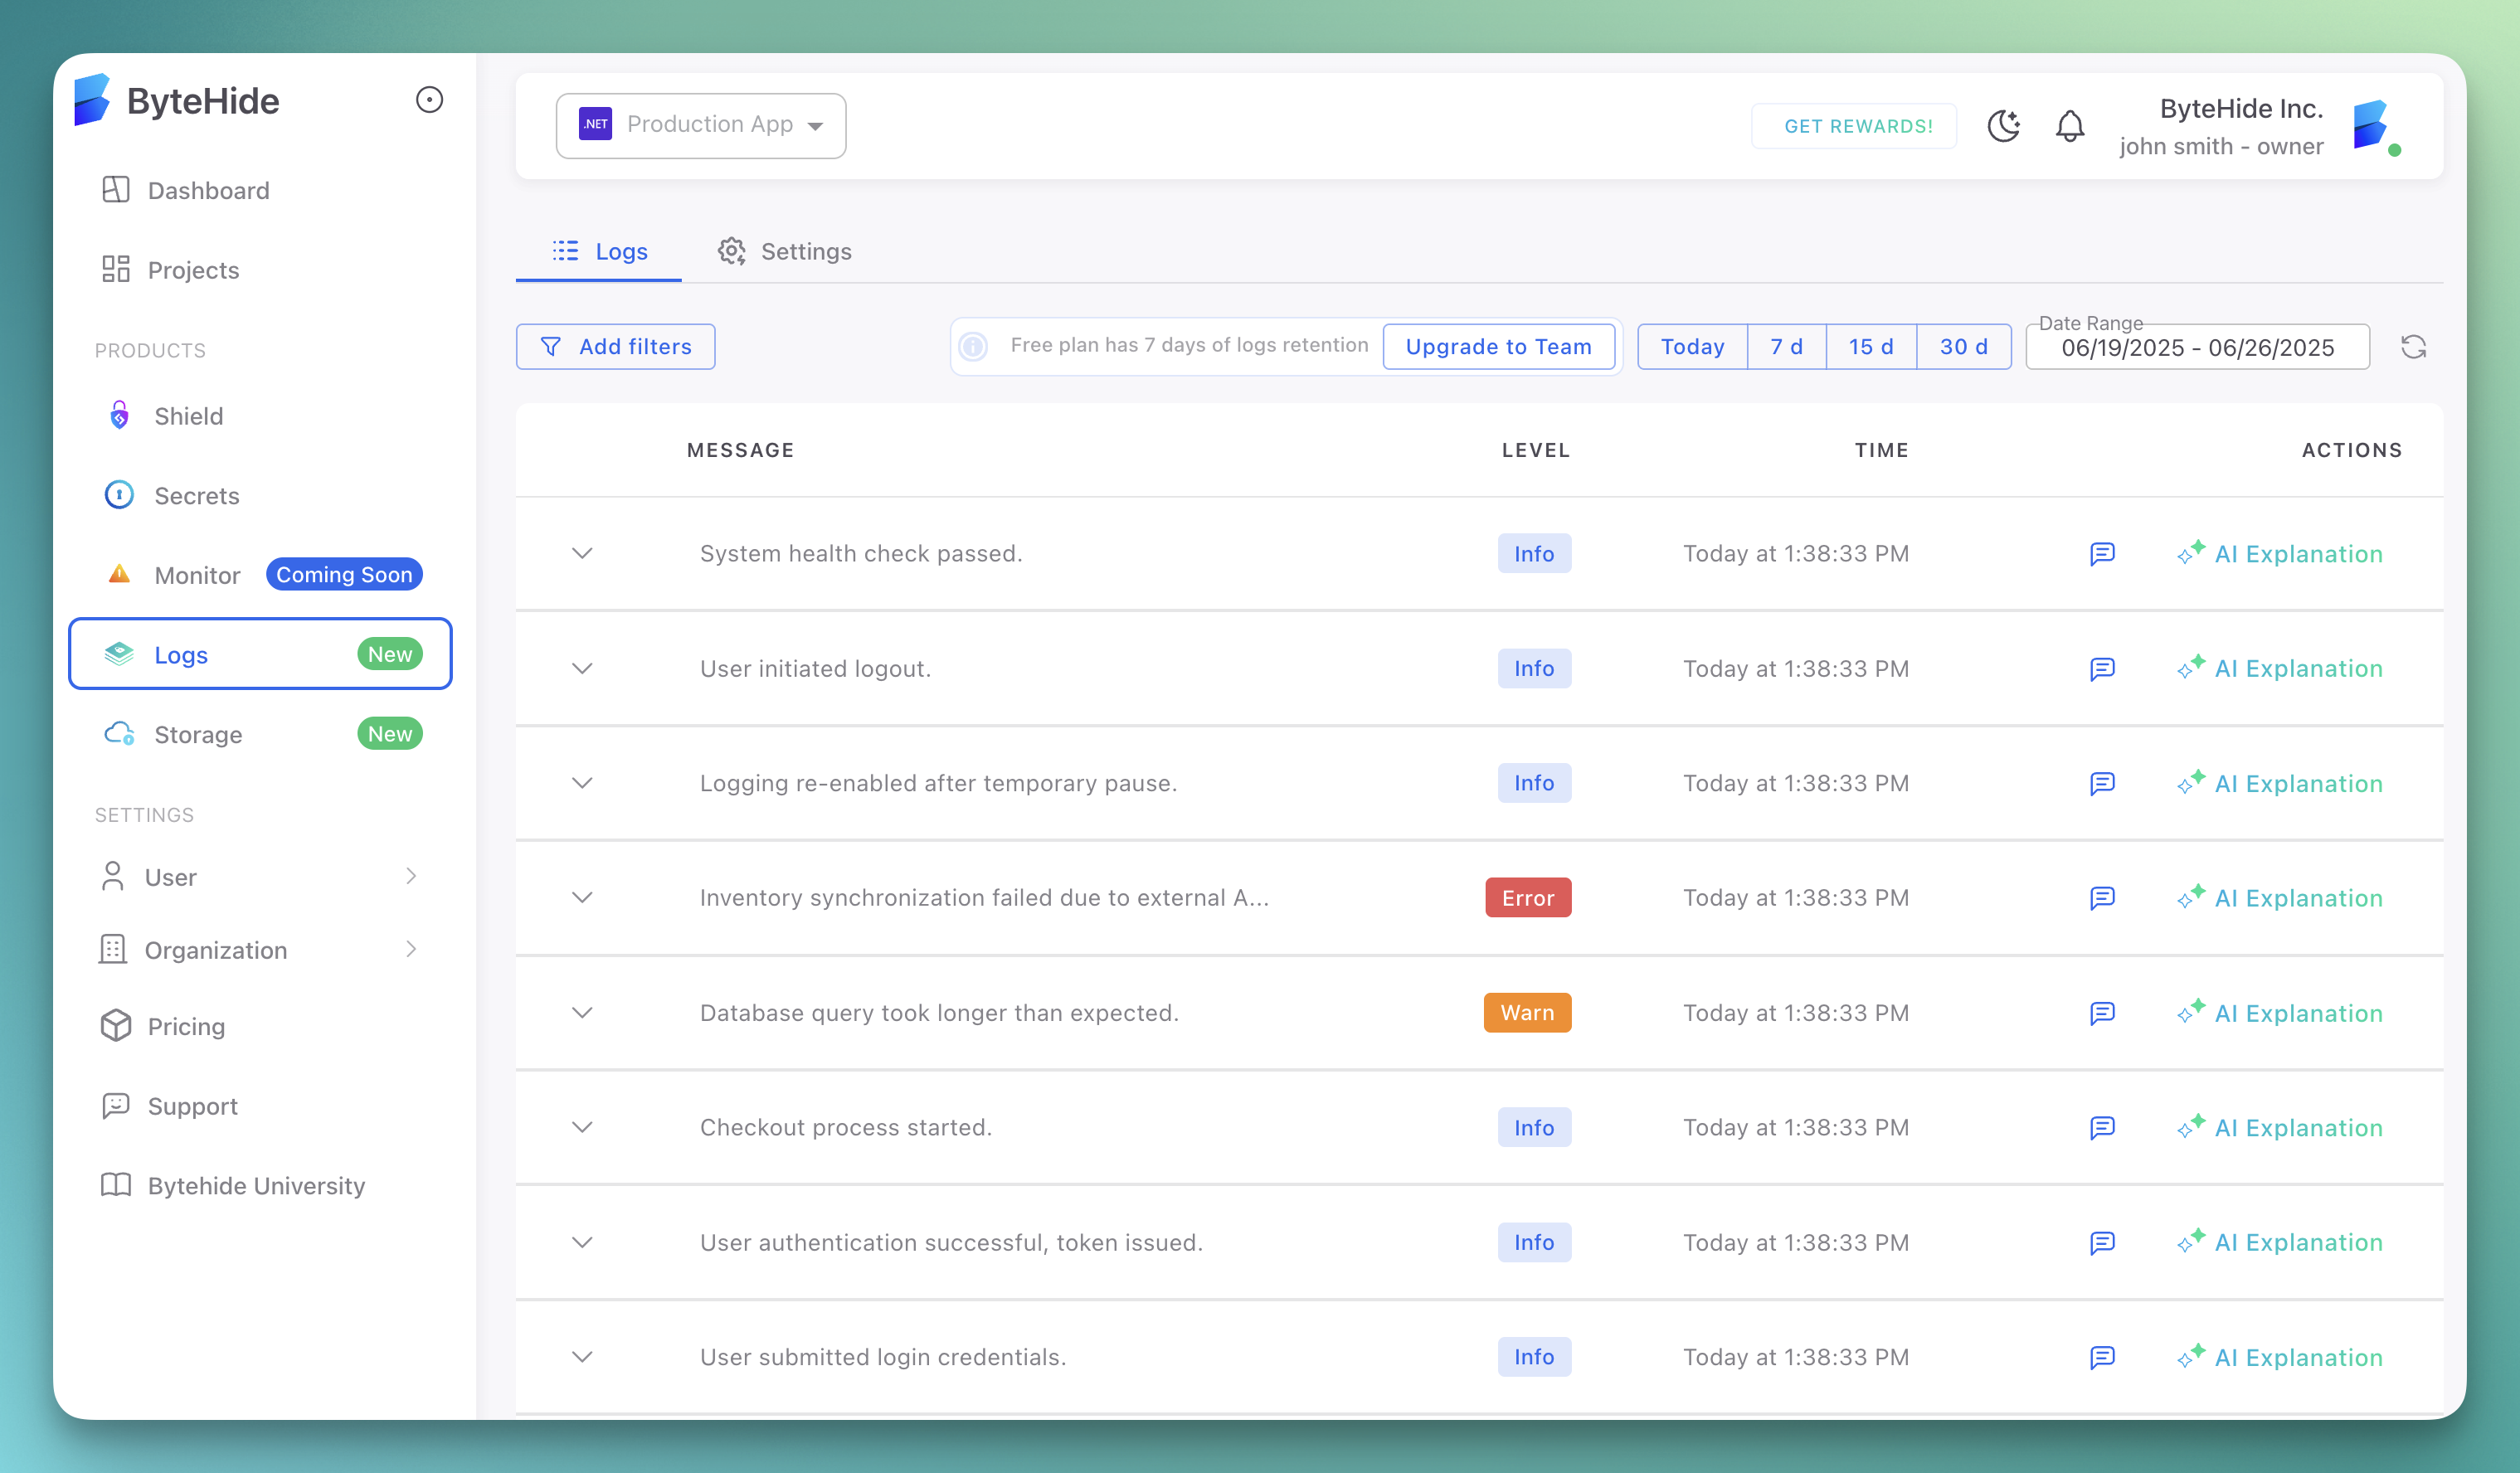
When enabled, every security incident Monitor detects is recorded in ByteHide Logs with full context: timestamp, detection type, payload, affected code, device fingerprint, confidence score, and response action taken. Events appear in your ByteHide Logs dashboard alongside application logs from other ByteHide modules.
 Click to expand
{
  "logging": {
    "bytehideLogs": {
      "enabled": true,
      "token": "${BYTEHIDE_LOGS_TOKEN}",
      "persist": true,
      "filePath": "logs/bytehide-logs-offline.json",
      "maskSensitiveData": ["password", "token", "apiKey", "secret"]
    }
  }
}
{
"logging": {
"bytehideLogs": {
"enabled": true,
"token": "${BYTEHIDE_LOGS_TOKEN}",
"persist": true,
"filePath": "logs/bytehide-logs-offline.json",
"maskSensitiveData": ["password", "token", "apiKey", "secret"]
}
}
}| Field | Type | Default | Description |
|---|---|---|---|
enabled | boolean | false | Enable ByteHide Logs integration |
token | string | - | ByteHide Logs API token |
persist | boolean | true | Store events locally when the API is unreachable, and sync when connectivity returns |
filePath | string | - | Path for offline event storage |
maskSensitiveData | array | - | Field names to mask in log output (e.g., ["password", "token"]) |
Offline Persistence
When persist is enabled, Monitor stores events locally if it cannot reach the ByteHide Logs API. Events are automatically synced when connectivity is restored. No events are lost during network outages.
Debug Logging
Debug logging is a separate toggle from the log level. When enabled, Monitor includes detailed threat information in API responses and log output: attack type, confidence score, payload, source parameter, and internal reference codes.
Security Risk in Production
Debug logging exposes security-sensitive information in HTTP responses. An attacker receiving detailed threat analysis in the response body learns exactly what Monitor detected, how confident it is, and which parameter triggered the detection. This information helps attackers refine their payloads to bypass protection. Never enable debug logging in production.
What Changes with Debug Enabled
With debug logging disabled, blocked requests return a generic response with no internal details:
{
  "status": 403,
  "message": "Request blocked.",
  "info": "This application is protected by ByteHide Monitor. Learn more at https://bytehide.com",
  "reference": "BHM-A1B2C3D4"
}
{
"status": 403,
"message": "Request blocked.",
"info": "This application is protected by ByteHide Monitor. Learn more at https://bytehide.com",
"reference": "BHM-A1B2C3D4"
}With debug logging enabled, the same blocked request returns full threat context:
{
  "type": "https://docs.bytehide.com/monitor/errors/sql-injection",
  "title": "SQL Injection Detected",
  "status": 403,
  "detail": "SQLite SQL Injection detected - query execution blocked",
  "instance": "/api/users?id=1 OR 1=1",
  "threatInfo": {
    "code": "BHM-T001",
    "category": "injection",
    "attackType": "SQL Injection",
    "confidence": 0.95,
    "payload": "1 OR 1=1 --",
    "source": "query.id",
    "reference": "BHM-A1B2C3D4"
  }
}
{
"type": "https://docs.bytehide.com/monitor/errors/sql-injection",
"title": "SQL Injection Detected",
"status": 403,
"detail": "SQLite SQL Injection detected - query execution blocked",
"instance": "/api/users?id=1 OR 1=1",
"threatInfo": {
"code": "BHM-T001",
"category": "injection",
"attackType": "SQL Injection",
"confidence": 0.95,
"payload": "1 OR 1=1 --",
"source": "query.id",
"reference": "BHM-A1B2C3D4"
}
}The threatInfo object is only included when debug logging is active. This level of detail is invaluable during development to verify that Monitor is detecting and categorizing threats correctly, but it must be disabled before deploying to any environment accessible to external users.
JSON Configuration
{
  "logging": {
    "debug": true
  }
}
{
"logging": {
"debug": true
}
}When to Use
- Verifying that a protection module detects a specific attack pattern during development
- Troubleshooting false positives or missed detections in a staging environment
- Confirming that cloud configuration sync applies the expected rules
- Diagnosing startup failures or configuration loading issues
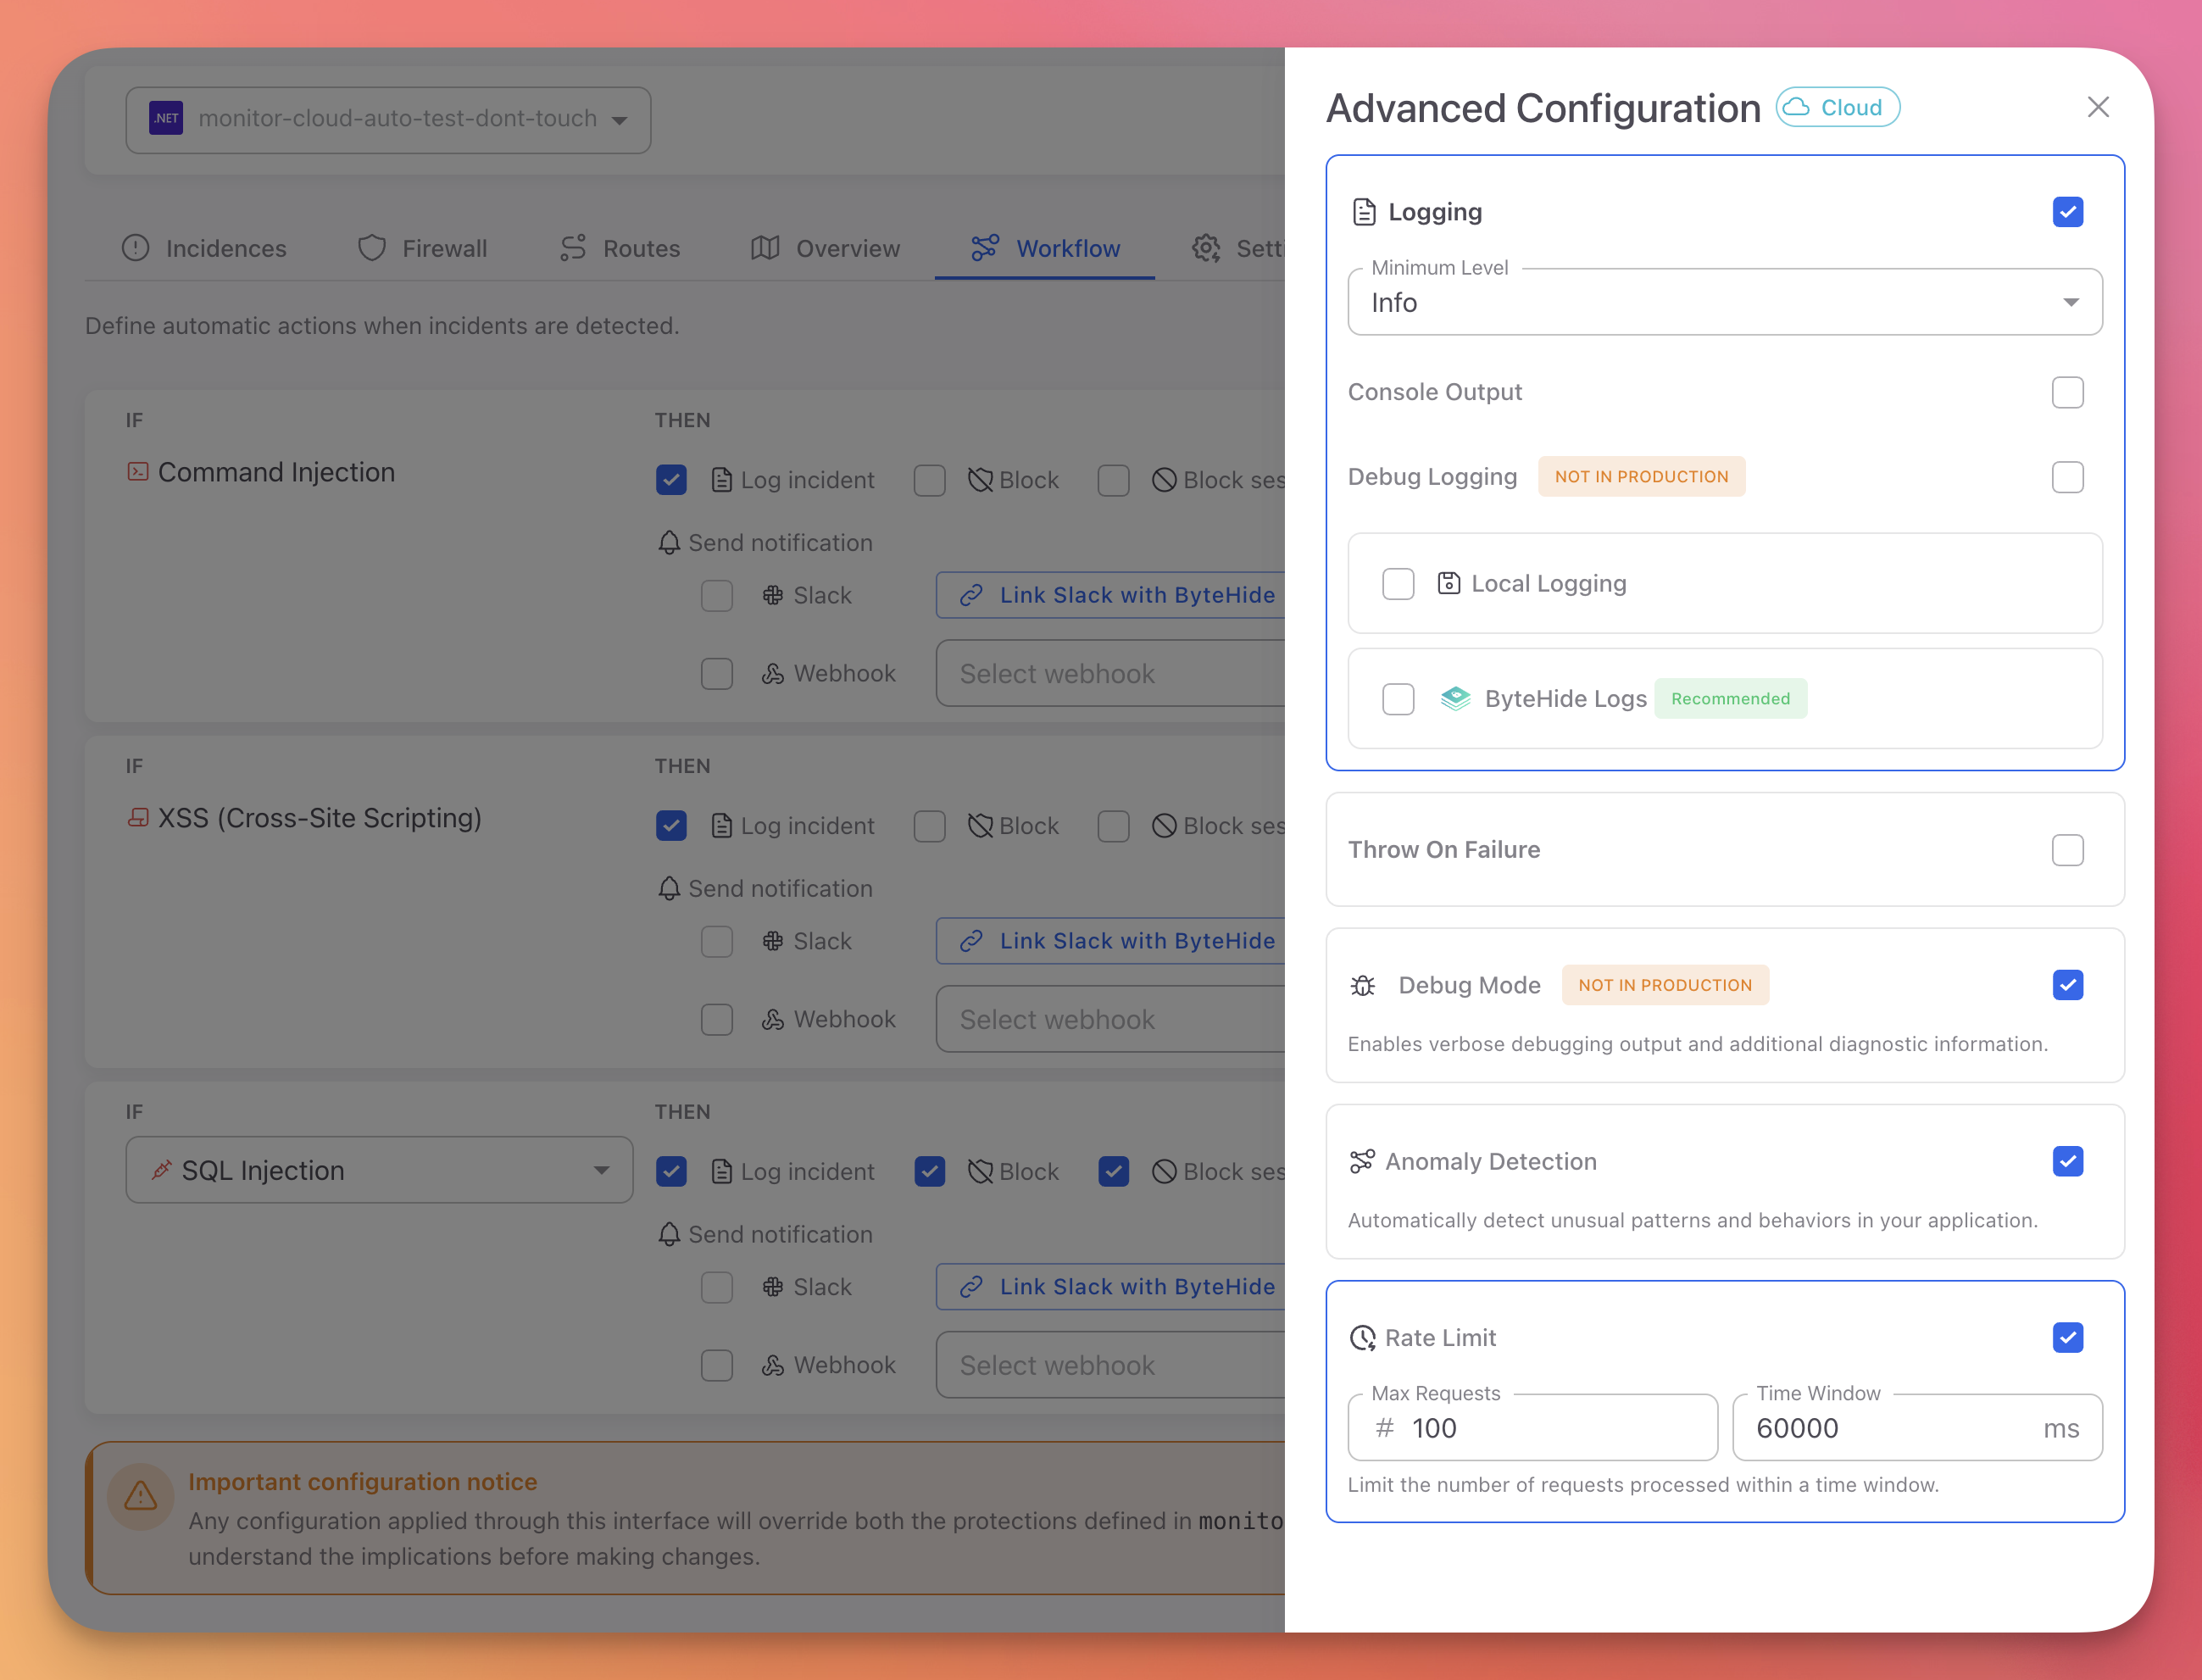
Cloud Dashboard Configuration
You can configure all logging settings from the Advanced Configuration panel in the Workflow tab of the Cloud Dashboard:
 Click to expand
| Setting | Description |
|---|---|
| Logging | Master toggle to enable or disable all logging |
| Minimum Level | Select the minimum log level (Debug, Info, Warning, Error, Critical) |
| Console Output | Toggle stdout output |
| Debug Logging | Toggle verbose diagnostic output (not for production) |
| Local Logging | Toggle file logging to disk |
| ByteHide Logs | Toggle integration with ByteHide Logs (recommended) |
Changes made in the Cloud Dashboard apply immediately to all running instances without redeployment.
Log Output Format
Monitor log entries include:
- Timestamp: When the event occurred
- Level: Log level (Debug, Info, Warning, Error, Critical)
- Module: Which protection module generated the event
- Message: Description of the event
- Threat Details: For detection events, includes threat type, confidence score, and action taken
Example console output:
[2025-01-15 10:23:45.123] [INFO]  Monitor initialized successfully
[2025-01-15 10:23:45.456] [INFO]  Protection modules loaded: 6 active
[2025-01-15 10:24:12.789] [WARN]  SqlInjection detected - Action: BLOCK - Confidence: 0.95
[2025-01-15 10:24:12.790] [INFO]  Incident reported to ByteHide Cloud
[2025-01-15 10:23:45.123] [INFO] Monitor initialized successfully
[2025-01-15 10:23:45.456] [INFO] Protection modules loaded: 6 active
[2025-01-15 10:24:12.789] [WARN] SqlInjection detected - Action: BLOCK - Confidence: 0.95
[2025-01-15 10:24:12.790] [INFO] Incident reported to ByteHide CloudBest Practices
- Set the minimum level to Info in production for a balance between visibility and log volume
- Enable ByteHide Logs in production for centralized, immutable forensic records
- Enable console logging in containerized environments (Docker, Kubernetes) where log collectors read from stdout
- Enable file logging in on-premise or offline deployments where cloud logging is not available
- Use
maskSensitiveDatato prevent passwords, tokens, and API keys from appearing in log output - Keep debug logging disabled in production. Enable it temporarily when troubleshooting, then disable it again
- Configure file rotation (
maxSizeMB,maxFiles) to prevent disk space issues in long-running applications
Next Steps
ByteHide Logs
Centralized, immutable logging for all ByteHide modules
Cloud Configuration
Configure logging from the Cloud Dashboard
JSON Configuration
Full JSON schema reference including logging options
Troubleshooting
Common issues and debugging steps