Routes
Track all API endpoints your application exposes and their request volumes. Identify which routes receive the most traffic and correlate with incident data to find potential attack surfaces.
Cloud Projects Only
The Routes tab is only available for Cloud / Web / API project types. On-Premise, Desktop, Mobile, and IoT projects do not have HTTP route tracking.
Routes Dashboard
 Click to expand
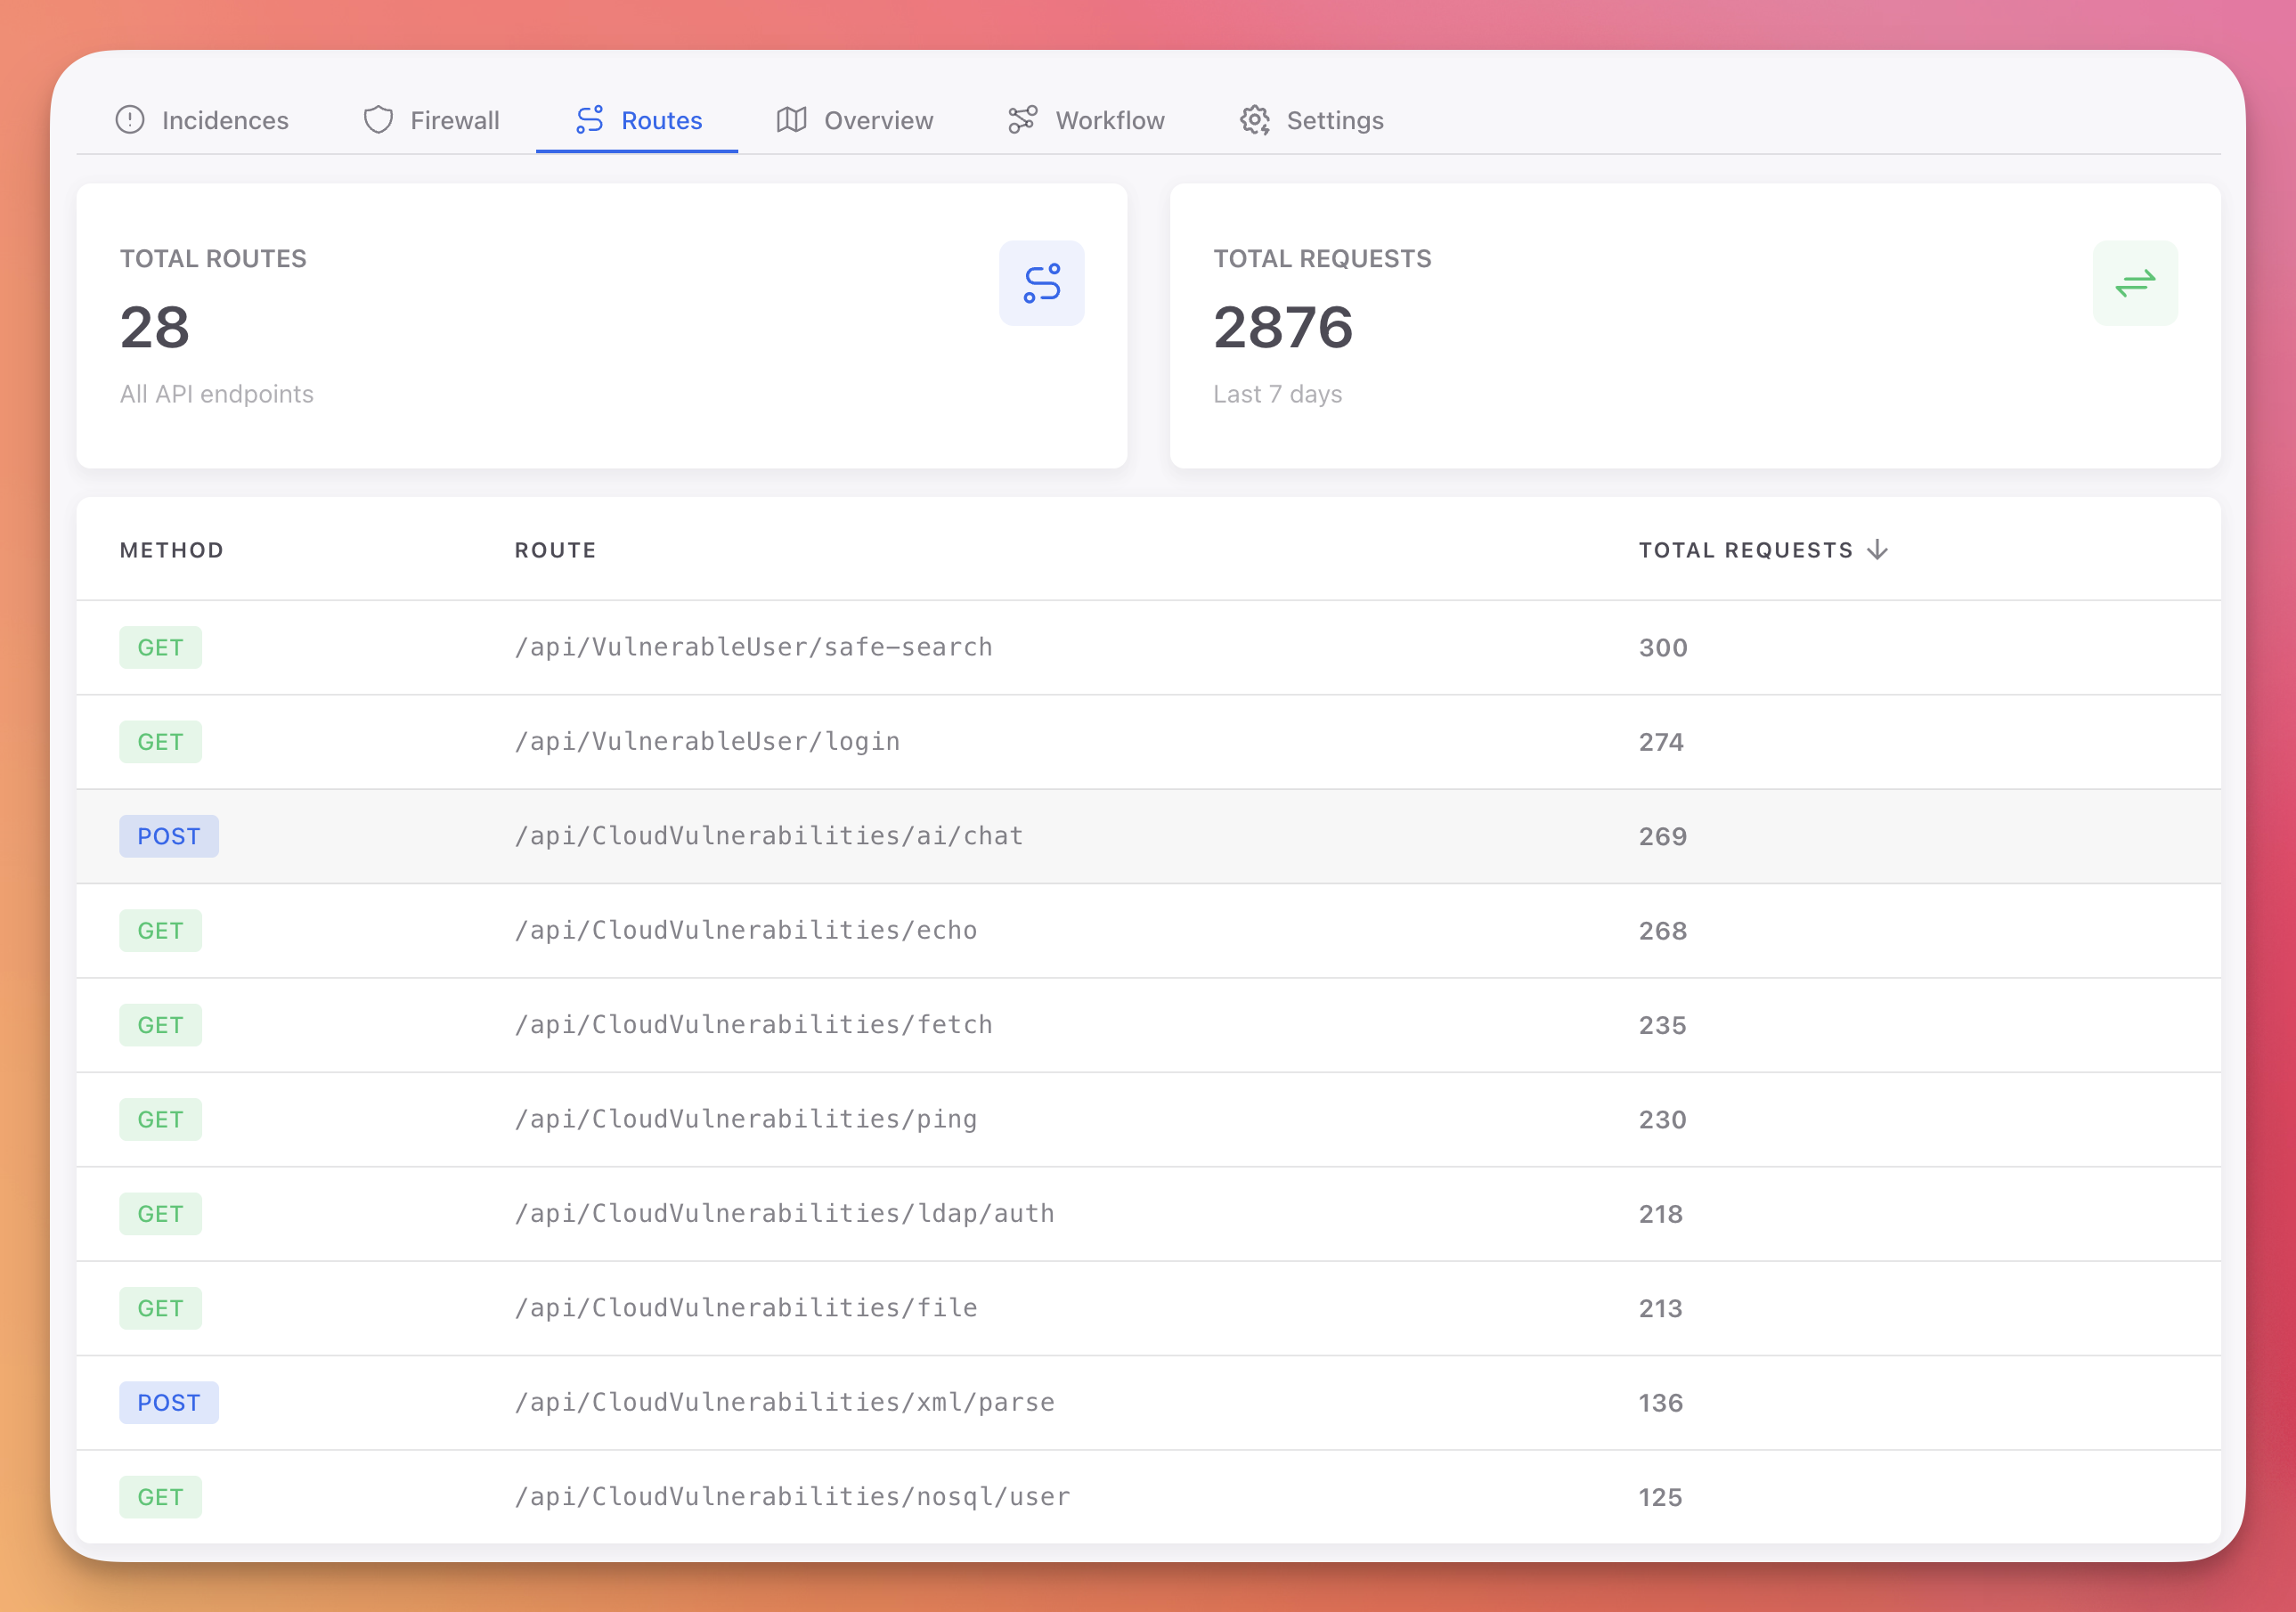
Statistics
Two cards at the top summarize your API surface:
| Card | Description |
|---|---|
| Total Routes | Number of unique API endpoints detected |
| Total Requests | Total request count over the last 7 days |
Routes Table
The table lists every endpoint Monitor has observed, with the following columns:
| Column | Description |
|---|---|
| Method | HTTP method badge: GET (green), POST (blue), PUT (yellow), DELETE (red) |
| Route | API endpoint path (e.g., /api/users/search) |
| Total Requests | Number of requests to this endpoint |
Routes are sorted by request volume (most requested first). The table includes pagination for large API surfaces.
How Routes Are Collected
Monitor automatically discovers and tracks routes as your application receives requests. No manual configuration is needed. Every HTTP request that passes through Monitor's middleware is recorded with its method and path.
This gives you visibility into:
- Your full API surface: See every endpoint your application exposes, including ones you may not have documented
- Traffic distribution: Identify which endpoints receive the most traffic
- Attack surface analysis: Correlate high-traffic endpoints with incidents from the Incidences tab to prioritize protection
- Unused endpoints: Find endpoints with zero or minimal traffic that could be candidates for removal
Next Steps
Incidences
View threats detected on your API endpoints
Firewall
Block malicious traffic at the network level
JSON Configuration
Configure per-endpoint protection overrides