Log Visualization
The ByteHide web panel provides a comprehensive interface to visualize and analyze all logs from your JavaScript applications in real-time.
Main Log View
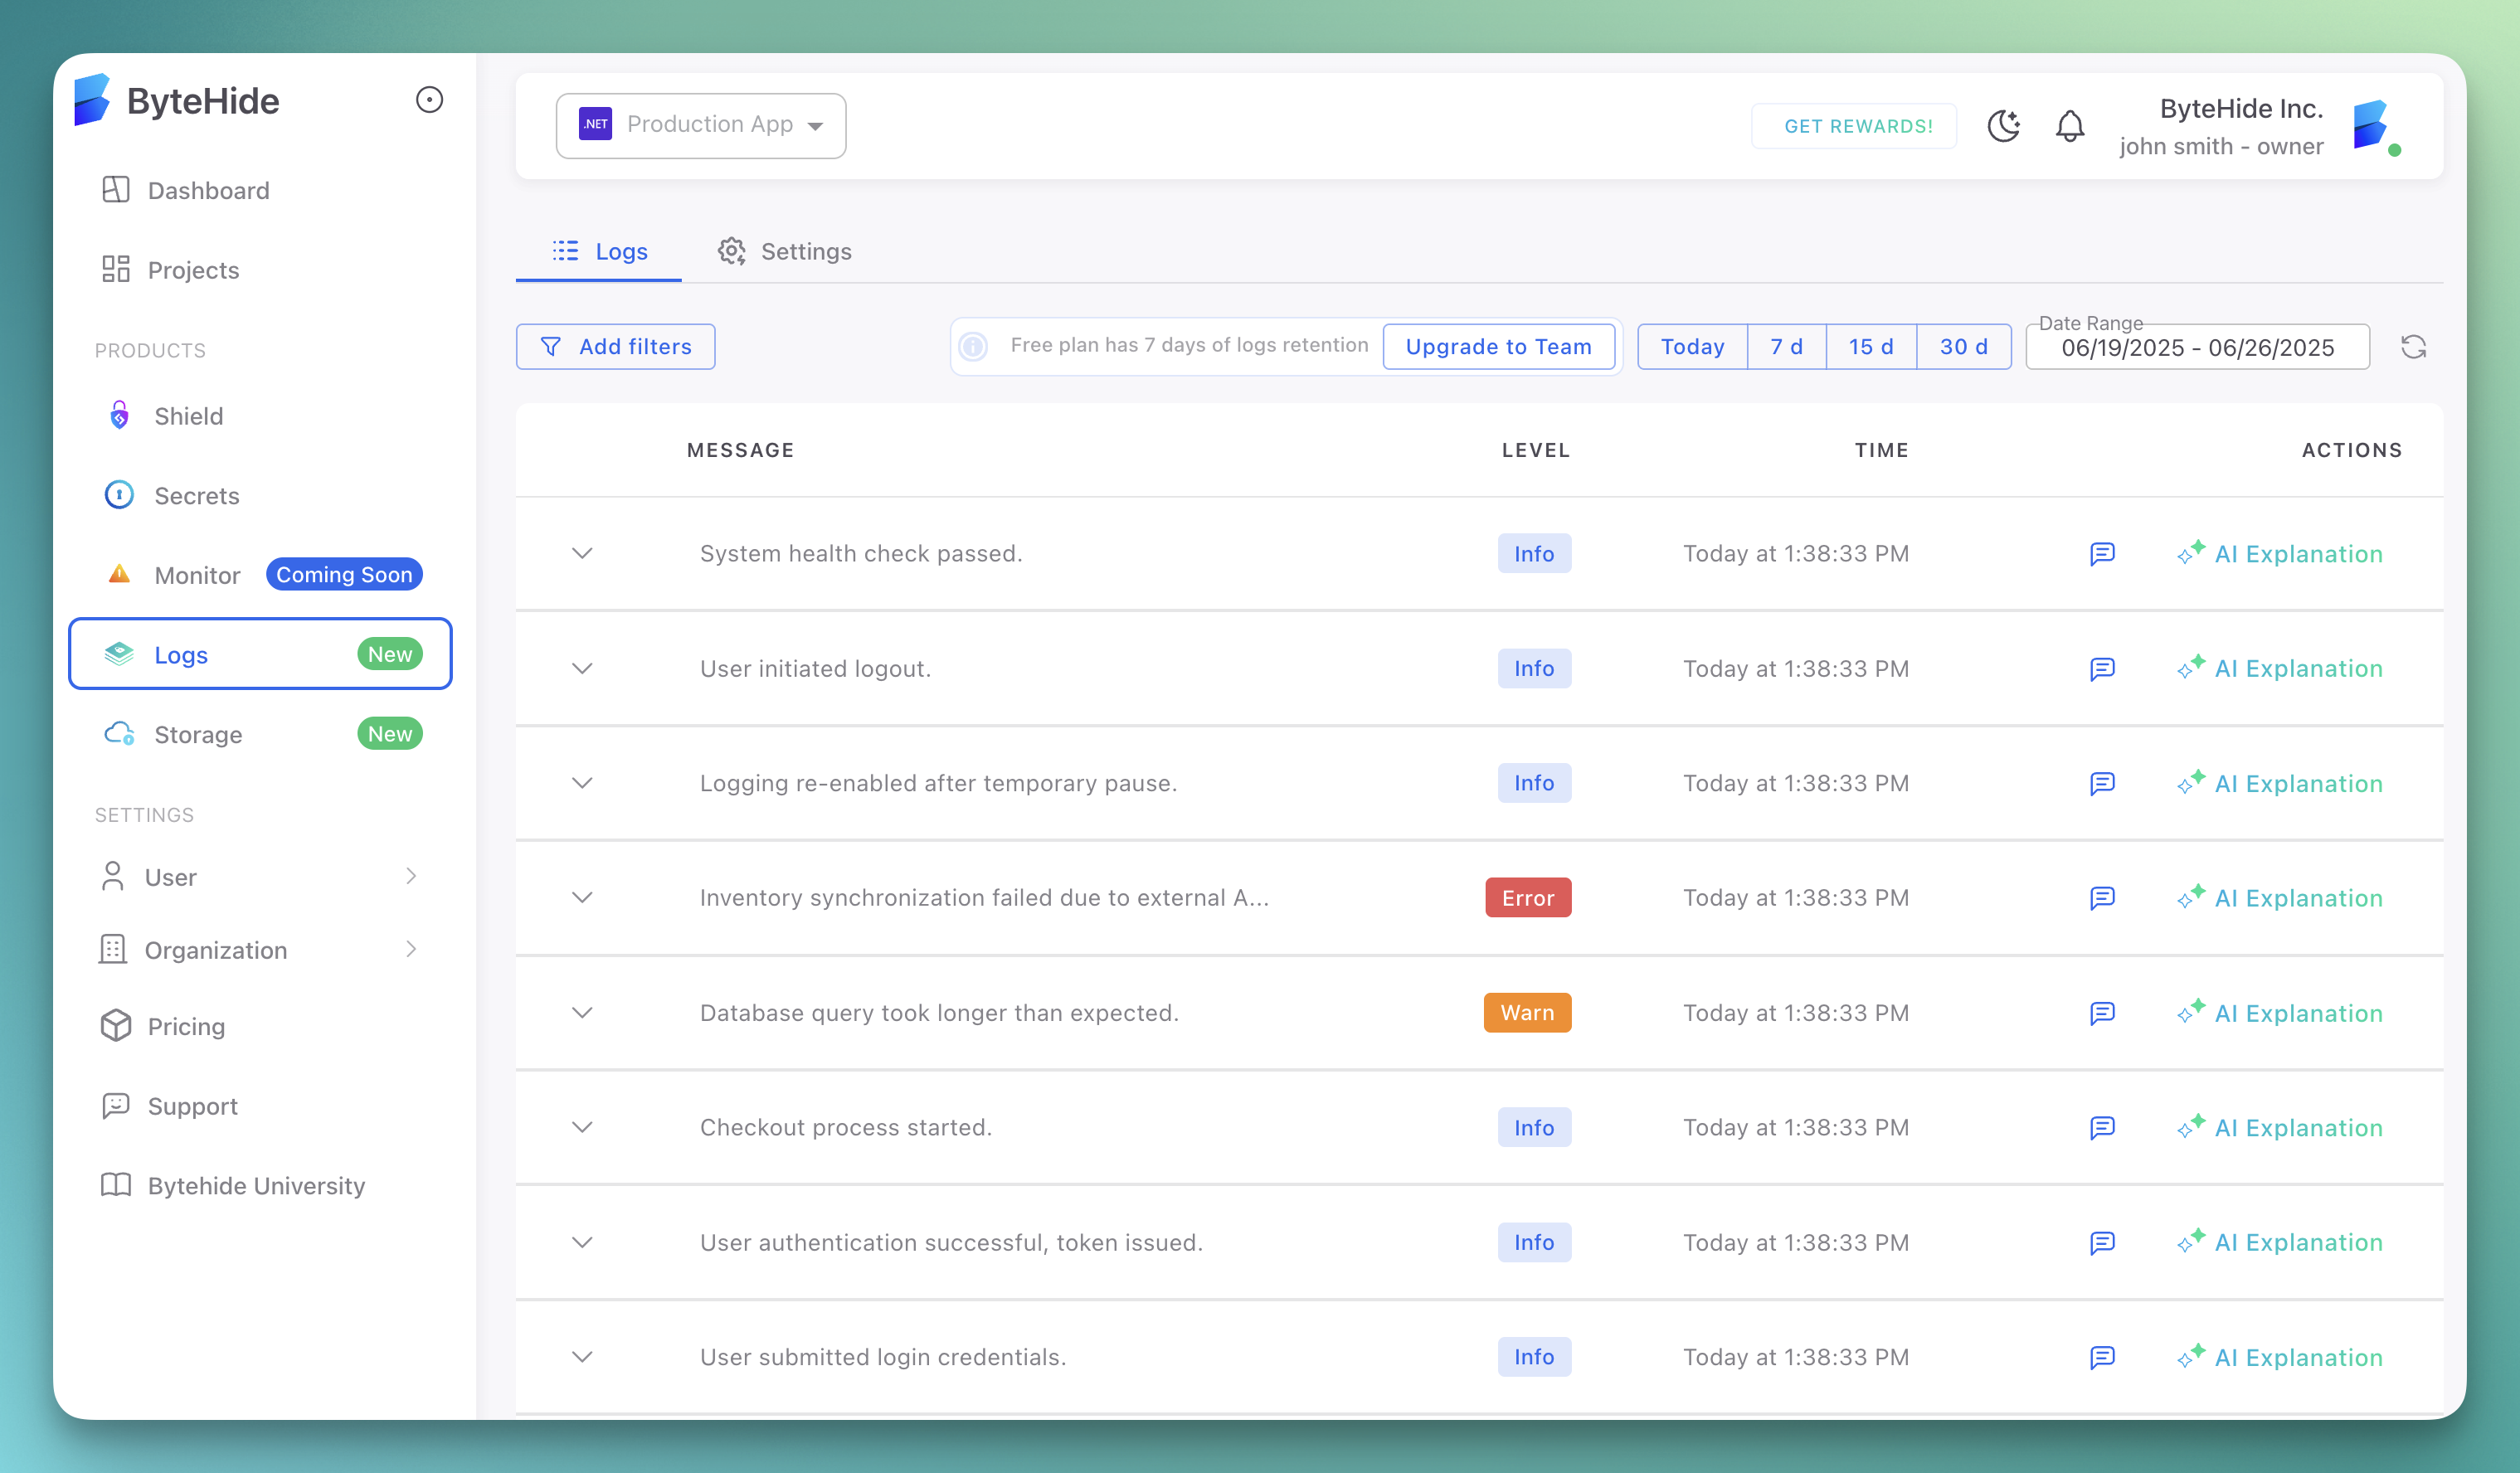
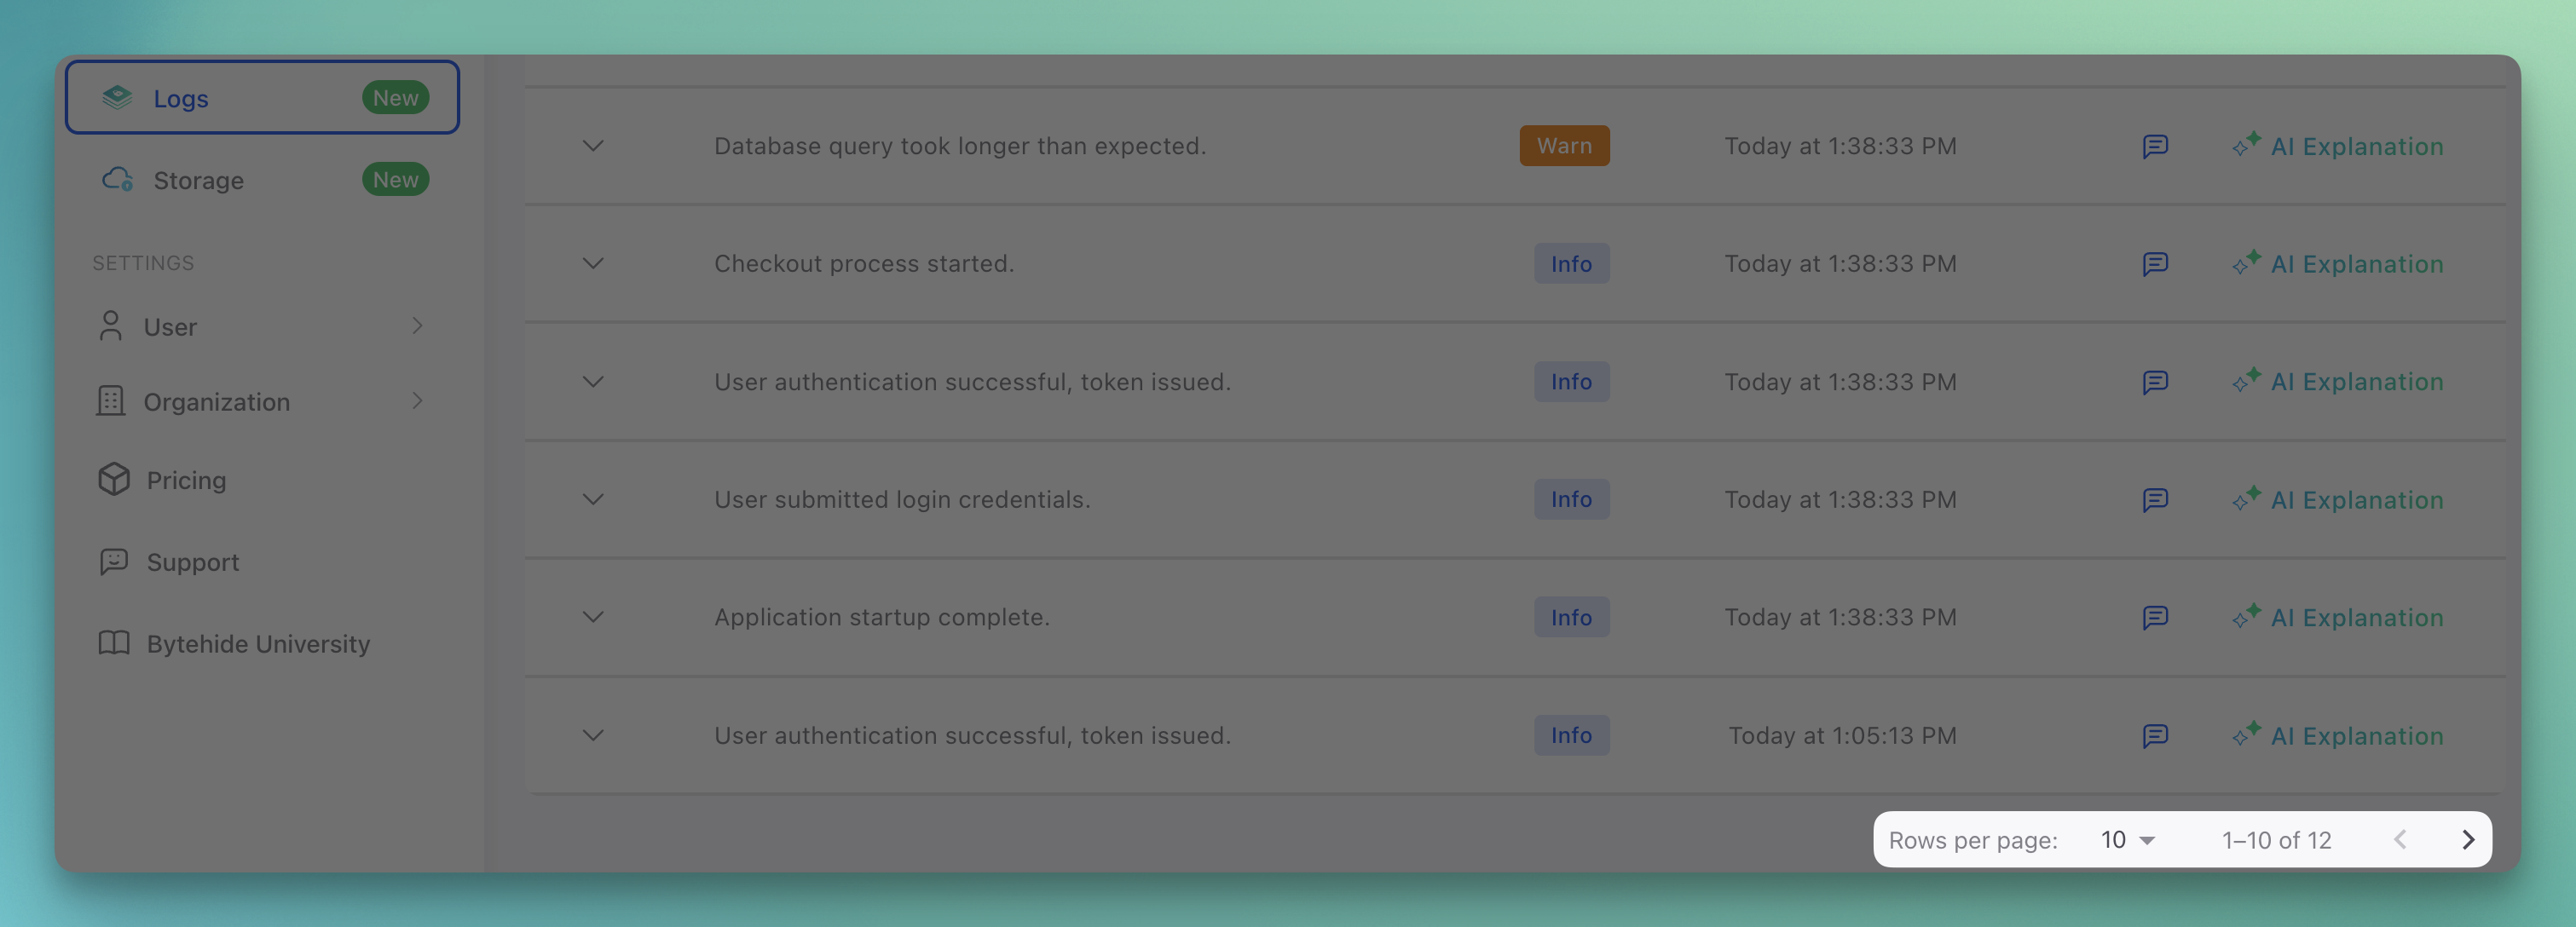
The main dashboard displays all your logs in a clean, organized table format.
 Click to expand
Log List Features
- Message: The main log message content
- Level: Log level with color-coded badges (Info, Warn, Error, Critical)
- Time: Timestamp when the log was generated
- Actions: Access to detailed view and AI explanations
Log Levels
Each log level is displayed with distinct visual indicators:
- Info: Blue badge for informational messages
- Warn: Orange badge for warnings
- Error: Red badge for errors
- Critical: Dark red badge for critical issues
Detailed Log View
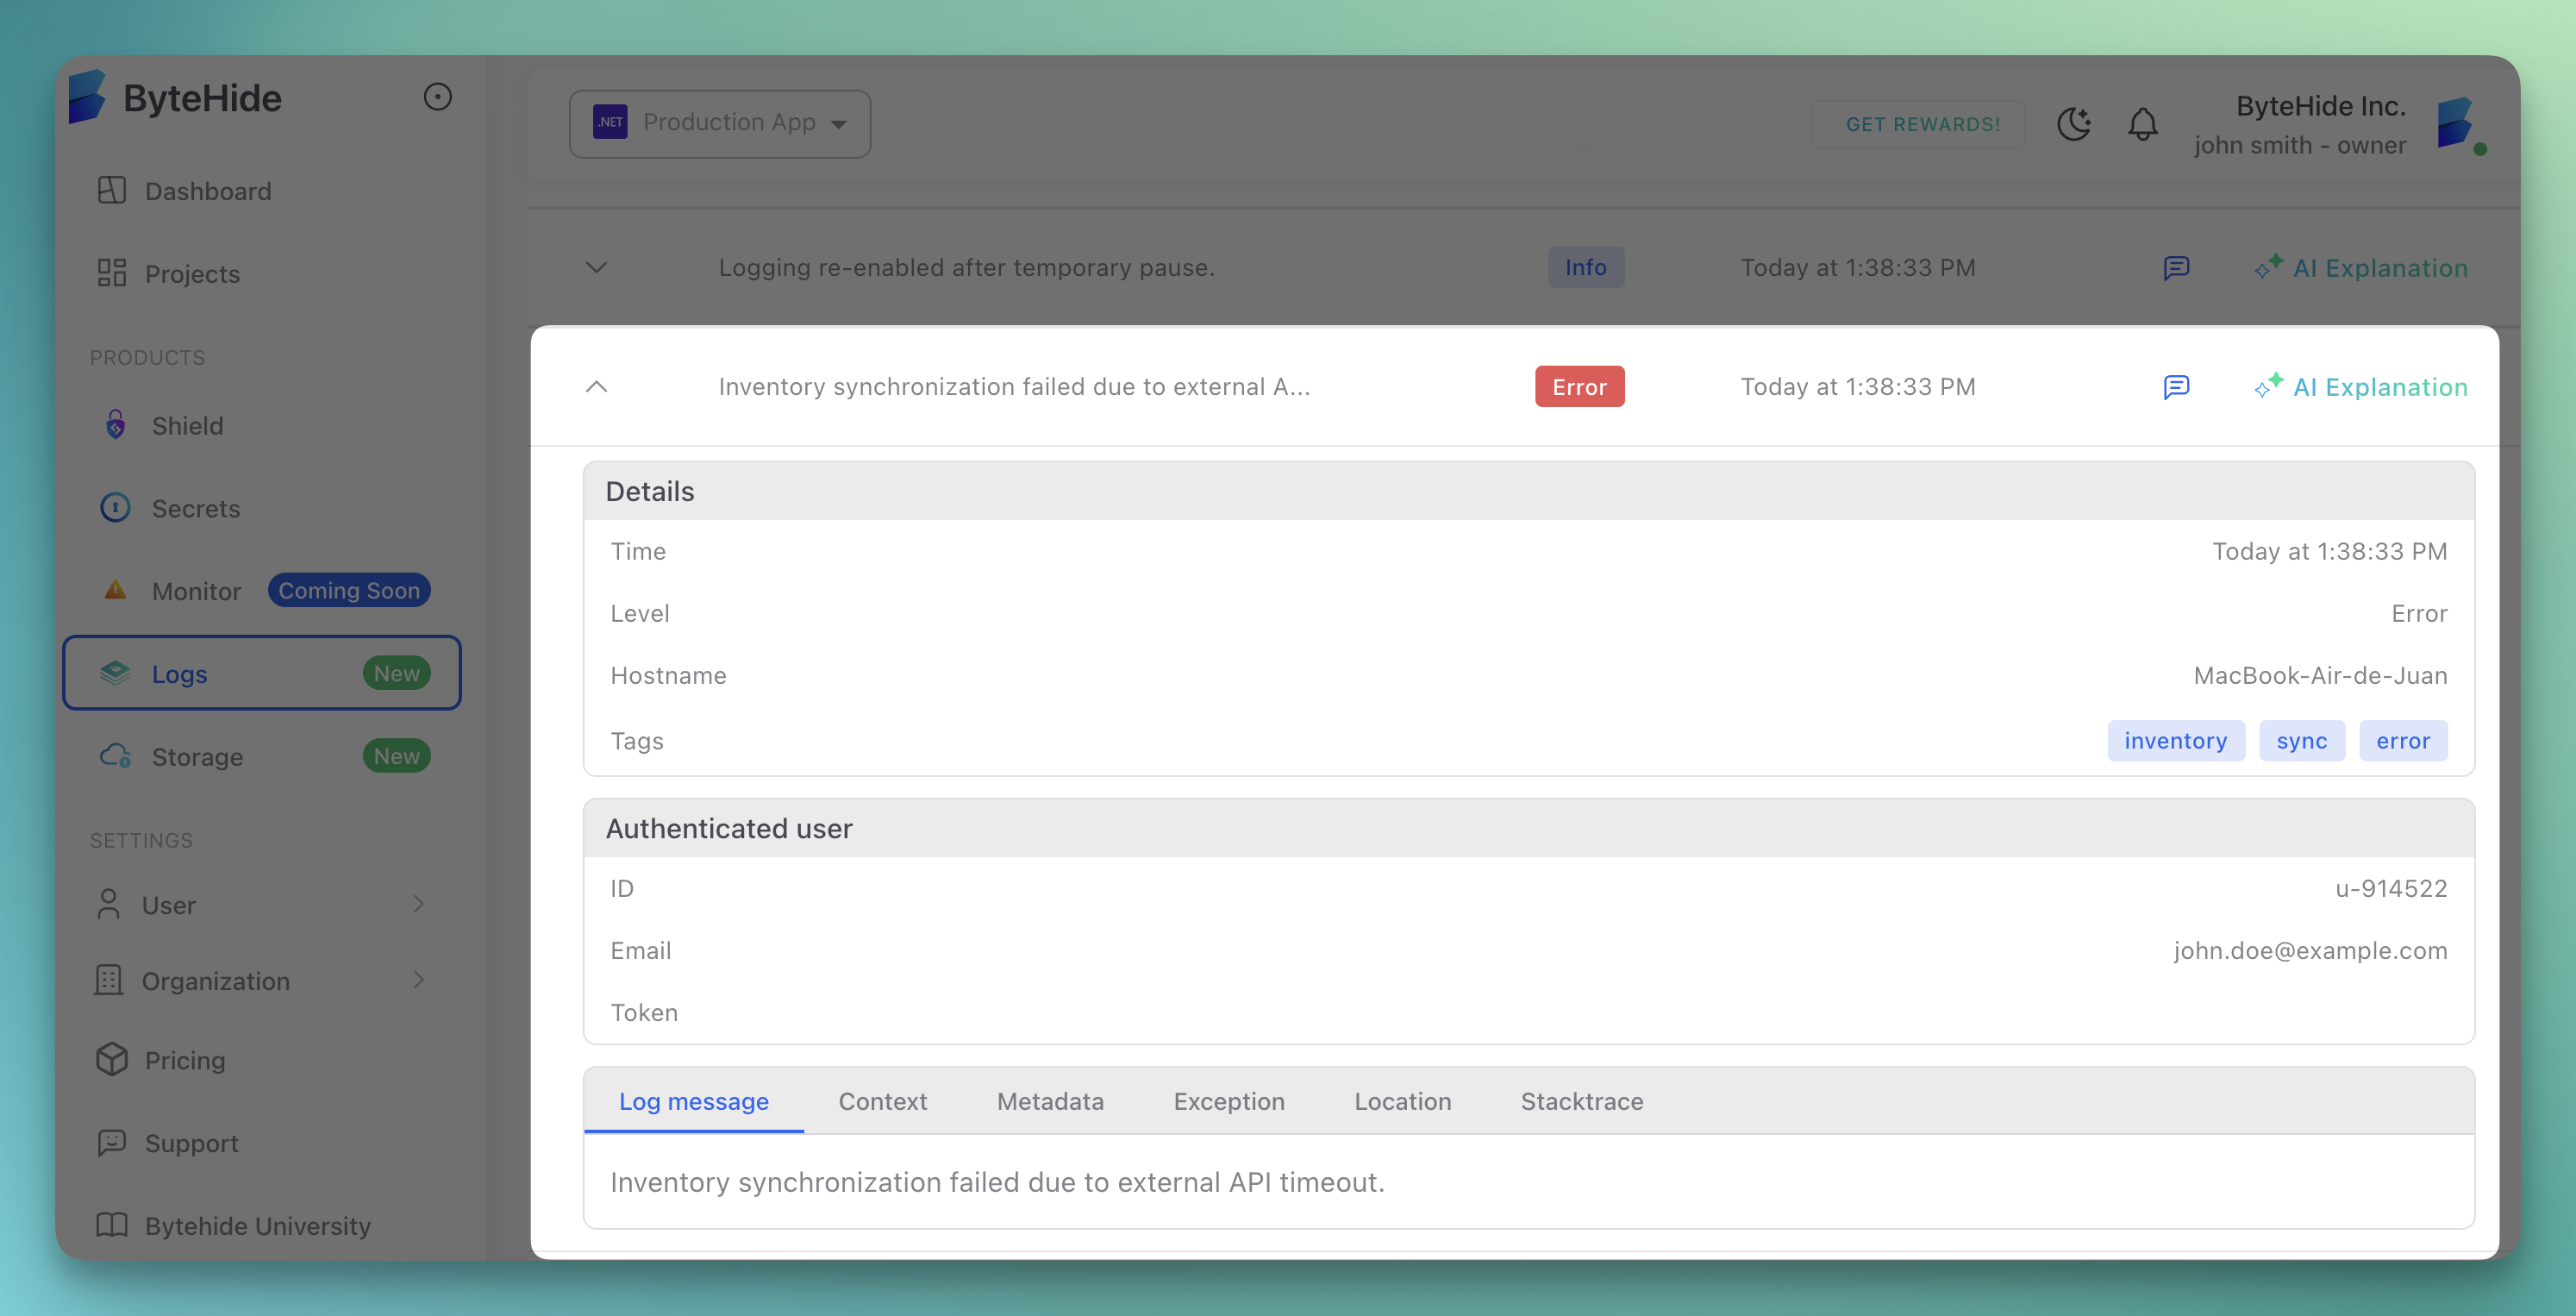
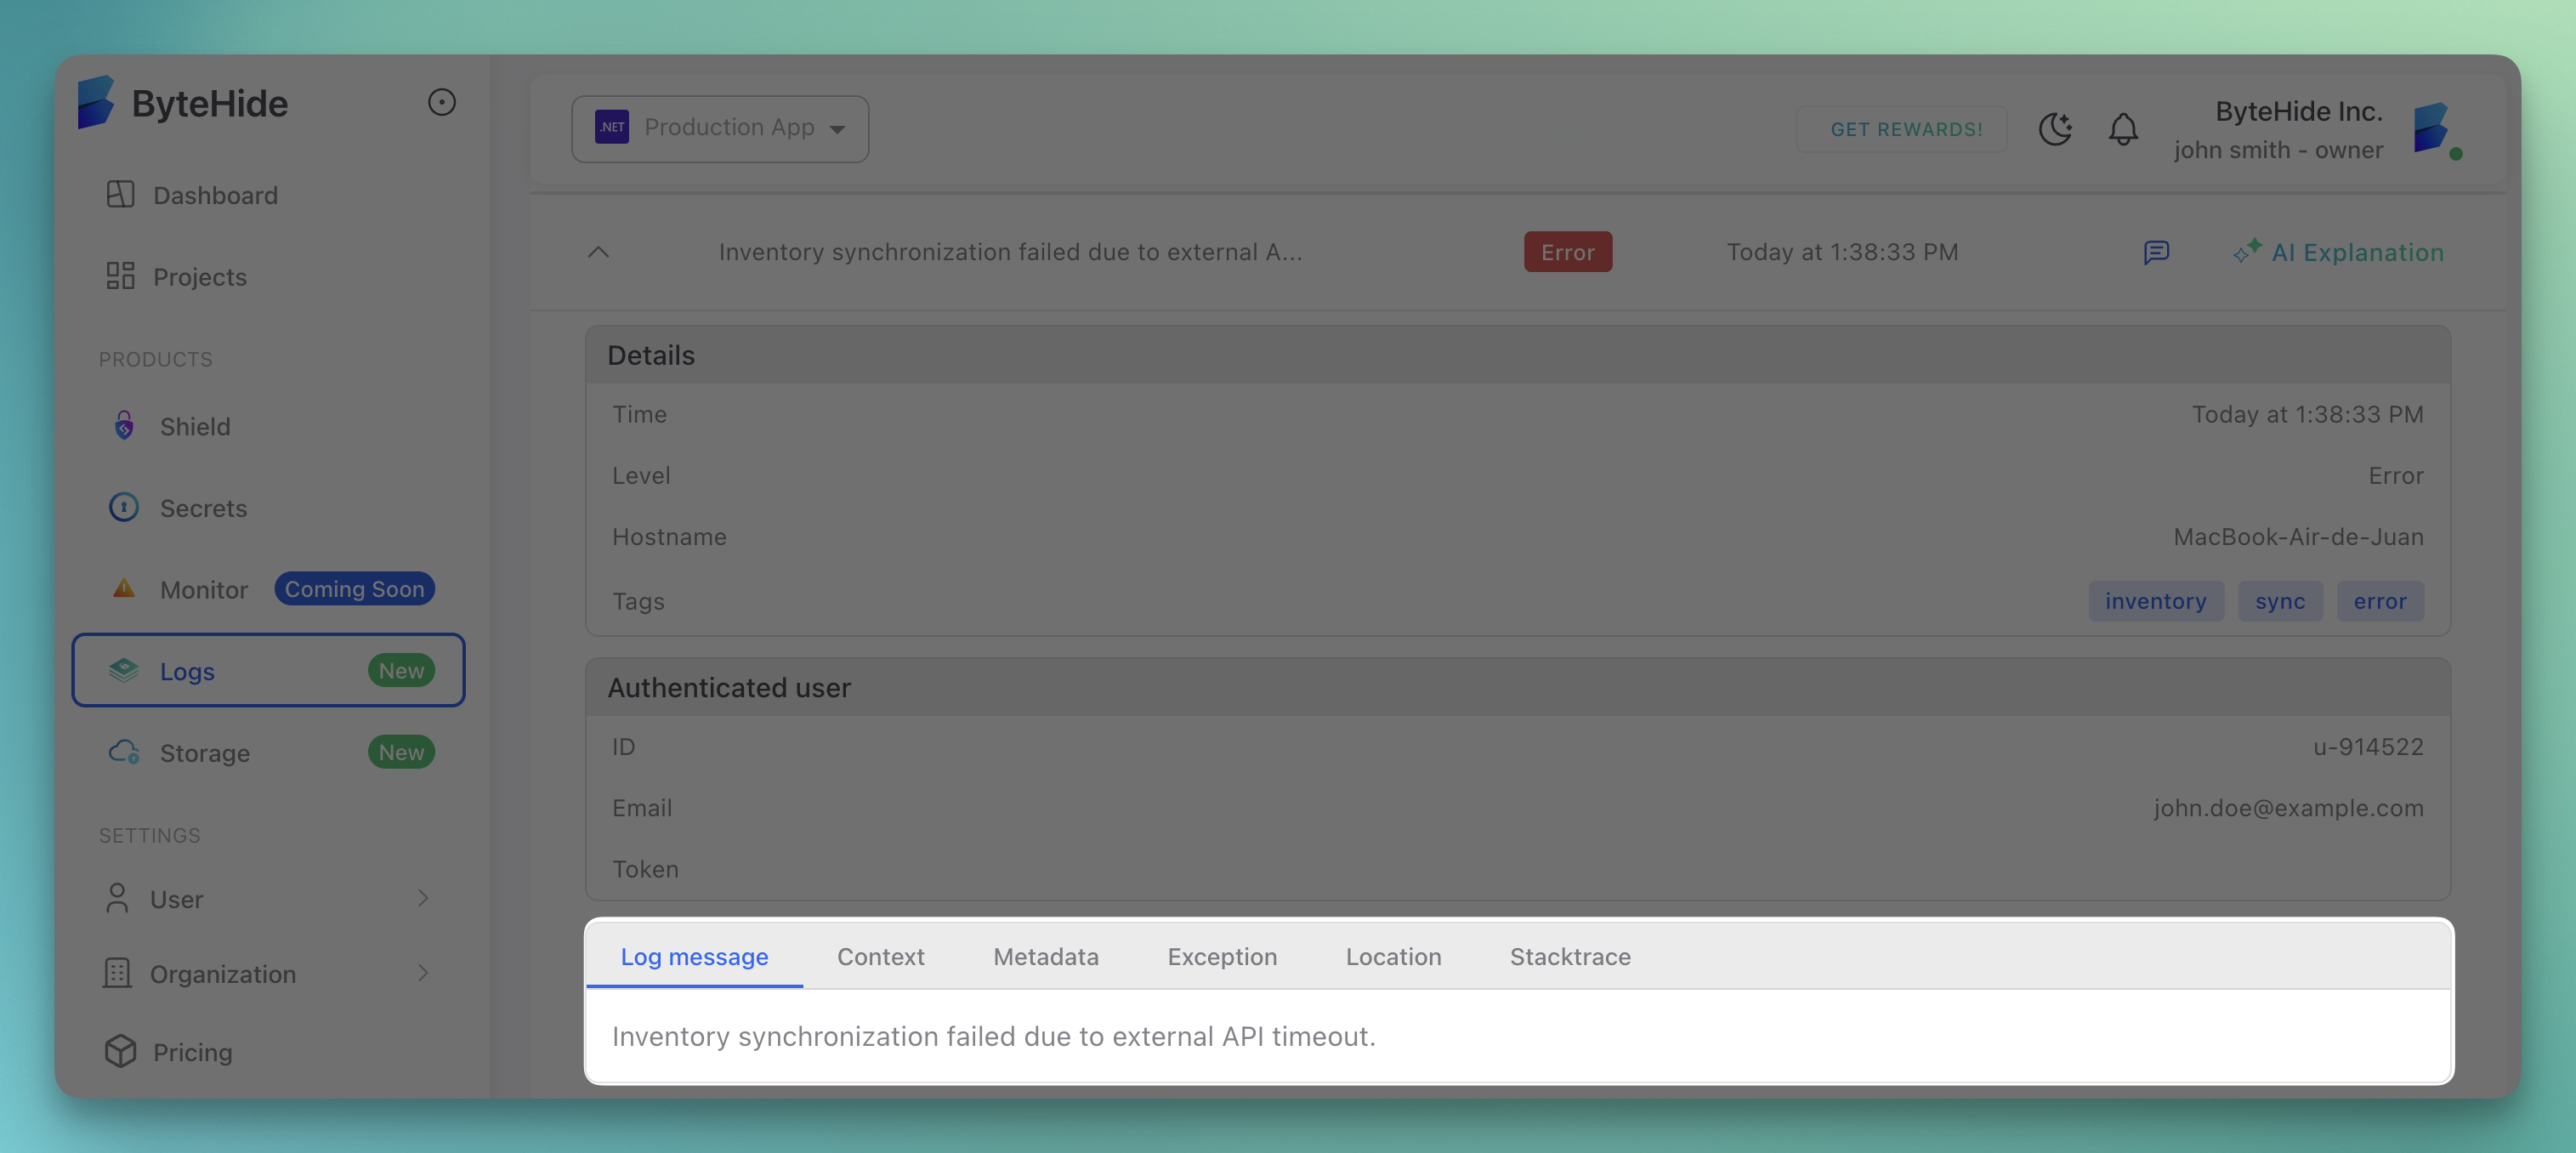
Click on any log entry to see comprehensive details in a modal window.
 Click to expand
Details Panel
The details panel shows:
- Time: Exact timestamp
- Level: Log severity level
- Hostname: Source machine name
- Tags: Associated tags for categorization
User Information
When available, authenticated user details are displayed:
- ID: User identifier
- Email: User email address
- Token: Authentication token (masked for security)
Multiple Tabs
The detail view organizes information into tabs:
- Log message: The main log content
- Context: Additional context data
- Metadata: Technical metadata and caller information
- Exception: Exception details if applicable
- Location: Source code location
- Stacktrace: Full stack trace for errors
 Click to expand
Context Information
The Context tab shows structured data passed with the log:
{
  "ERROR": {
    "message": "Database connection failed: timeout after 30 seconds"
  },
  "REQUEST_ID": "req_98f5d4e2a1",
  "USER_ID": "user_12345"
}
{
"ERROR": {
"message": "Database connection failed: timeout after 30 seconds"
},
"REQUEST_ID": "req_98f5d4e2a1",
"USER_ID": "user_12345"
}Metadata View
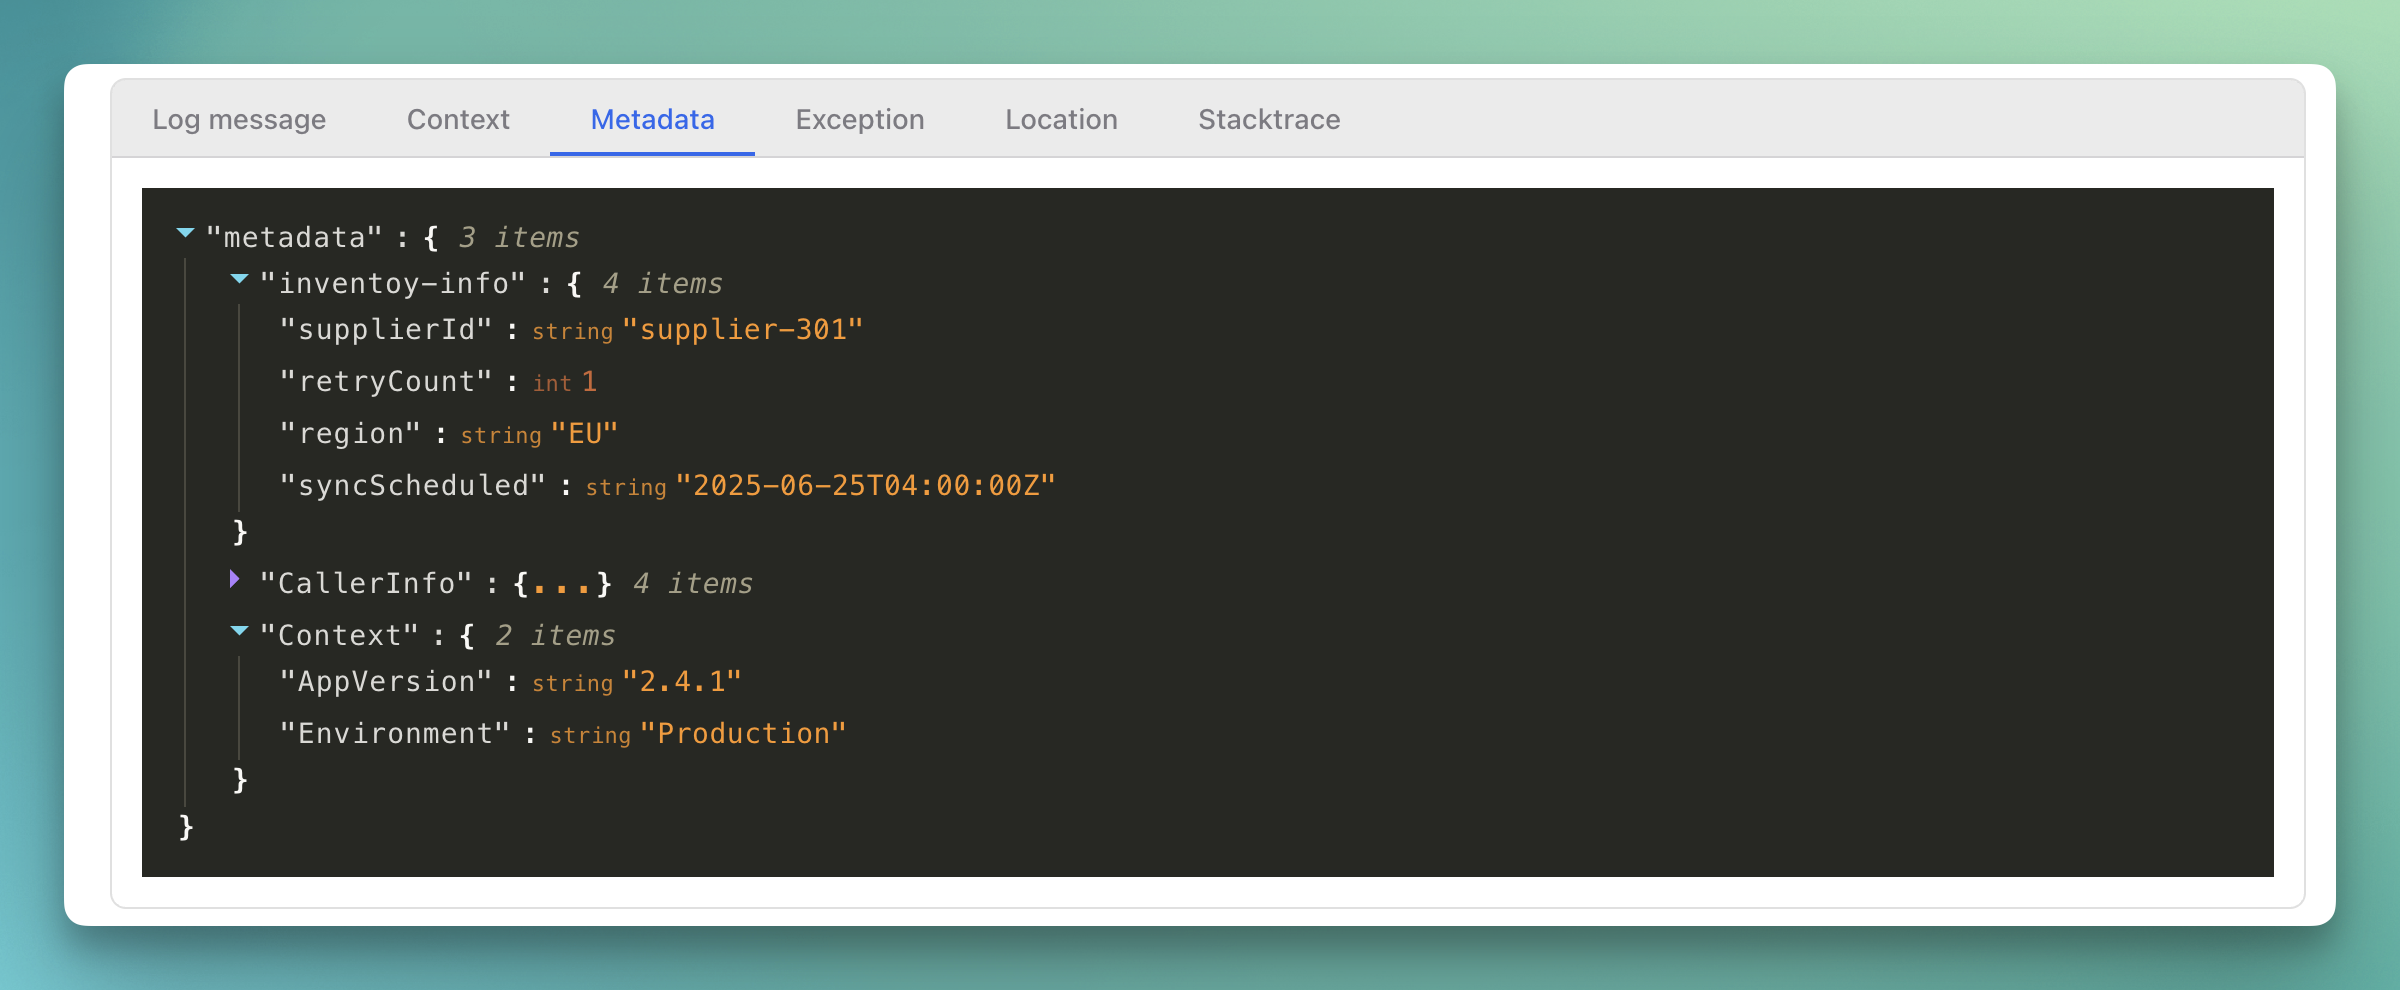
The Metadata tab displays technical information:
- CallerInfo: Method, file, and line number
- StackTrace: Full call stack
- Context: Additional application context like version
 Click to expand
Example Metadata Structure
{
  "metadata": {
    "CallerInfo": {
      "method": "ProcessPayment",
      "file": "/src/Services/PaymentService.cs",
      "line": 142,
      "stackTrace": "at PaymentService.ProcessPayment() in /src/Services/PaymentService.cs:line 142\n   at OrderController.CreateOrder() in /src/Controllers/OrderController.cs:line 87"
    },
    "Context": {
      "AppVersion": "2.1.4",
      "Environment": "Production",
      "CorrelationId": "order_abc123"
    }
  }
}
{
"metadata": {
"CallerInfo": {
"method": "ProcessPayment",
"file": "/src/Services/PaymentService.cs",
"line": 142,
"stackTrace": "at PaymentService.ProcessPayment() in /src/Services/PaymentService.cs:line 142\n at OrderController.CreateOrder() in /src/Controllers/OrderController.cs:line 87"
},
"Context": {
"AppVersion": "2.1.4",
"Environment": "Production",
"CorrelationId": "order_abc123"
}
}
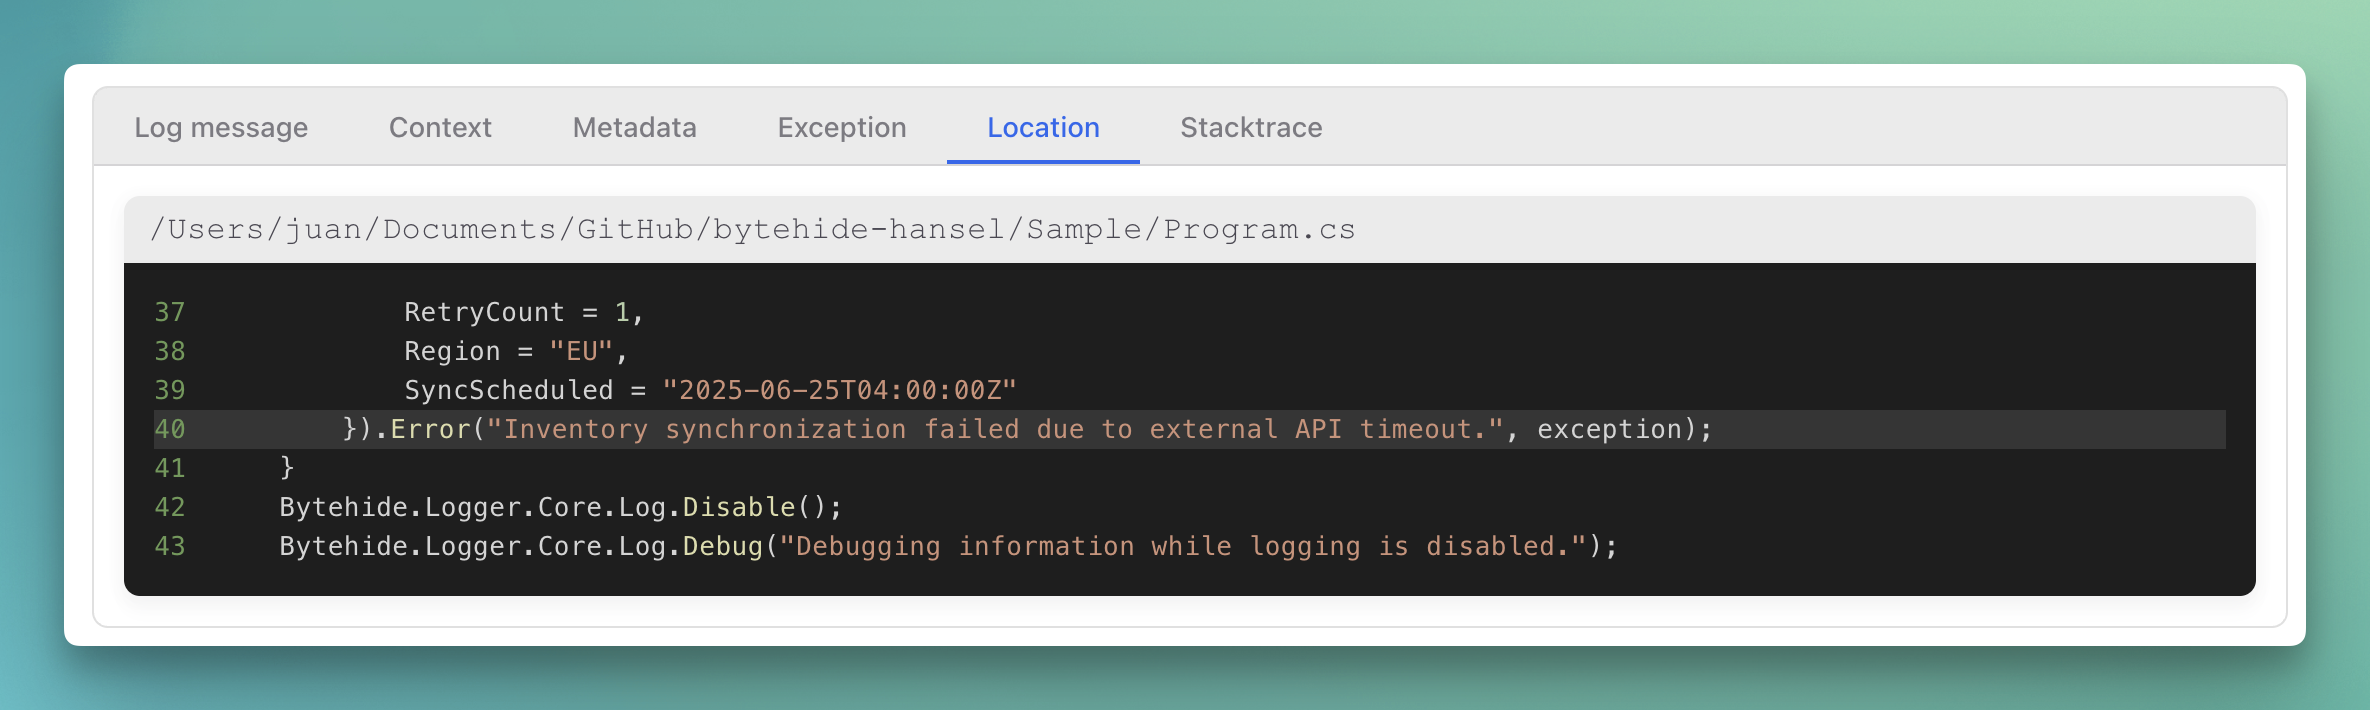
}Location Details
Shows the exact source code location where the log was generated:
- File path
- Line numbers
- Method names
- Stack trace navigation
 Click to expand
Real-time Updates
Logs appear in real-time as your application generates them, allowing for:
- Live monitoring during development
- Real-time debugging of production issues
- Immediate visibility into application behavior
Pagination
Navigate through large log volumes with:
- Rows per page: Configurable (10, 20, 50, etc.)
- Page navigation: Previous/next controls
- Total count: Display of current range (e.g., "11-20 of 28")
 Click to expand
Quick Actions
Each log entry provides instant access to:
- View Details: Expand full log information
- AI Explanation: Get AI-powered analysis of the log
- Copy: Copy log details to clipboard
Visual Indicators
The interface uses clear visual cues:
- Color-coded levels: Instant recognition of log severity
- Expandable rows: Click to see more details
- Status badges: Clear identification of log types
- Timestamps: Easy time-based log correlation
Next Steps
- Filtering & Search - Learn how to filter and search logs
- AI Assistant - Get AI-powered log analysis
- Comments & Collaboration - Collaborate on log analysis